
10 Usual hours worked
Tan Nguyen
Key Takeaways
This chapter reports the demographic characteristics of the oral health workforce average weekly usual number of hours worked.
- DT and DH‘s median weekly hours worked were 30 hours.
- OHT‘s median weekly hours worked were 37 hours.
- The median number of weekly hours worked by the oral health workforce ranged from 32 to 35 hours according to the state of primary practice.
- There is general decreasing trend in the median number of weekly hours worked as the age and years of practice increased.
Usual hours worked
The weighted median number of hours worked per week in each division is reported in Figure 10.1. The DH and DT professions were similar reporting an average 30 hours weekly, whereas OHTs reported 37 hours.
Table 10.1 reports the oral health workforce median weekly number of hours worked according to categories of age, gender, state of primary practice and number of years of practice. The unweighted characteristics of survey participants for the oral health workforce median weekly number of hours are reported in Appendix Table 10.1.
The highest median number of weekly hours worked for the oral health workforce was 38 hours, which was associated with age less than 30 years, male, and less than 10 years of practice. The second highest median number of weekly hours worked was 35 hours for the oral health workforce who were working primarily in QLD, SA and WA.
The lowest median number of weekly hours worked for the oral health workforce was 24 hours, which was associated with age older than 60 years. The second lowest median number of weekly hours worked was 27 hours for the oral health workforce who have practiced for more than 30 years.
The median number of weekly hours worked by the oral health workforce ranged from 32 to 35 hours according to the state of primary practice. There is general decreasing trend in the median number of weekly hours worked as the age (38 to 24 hours) and years of practice (38 to 27 hours) categories increased. Males reported a higher median number of weekly hours worked (38 hours) compared to females (33 hours).
Figure 10.1. Weighted median number of hours worked weekly by division
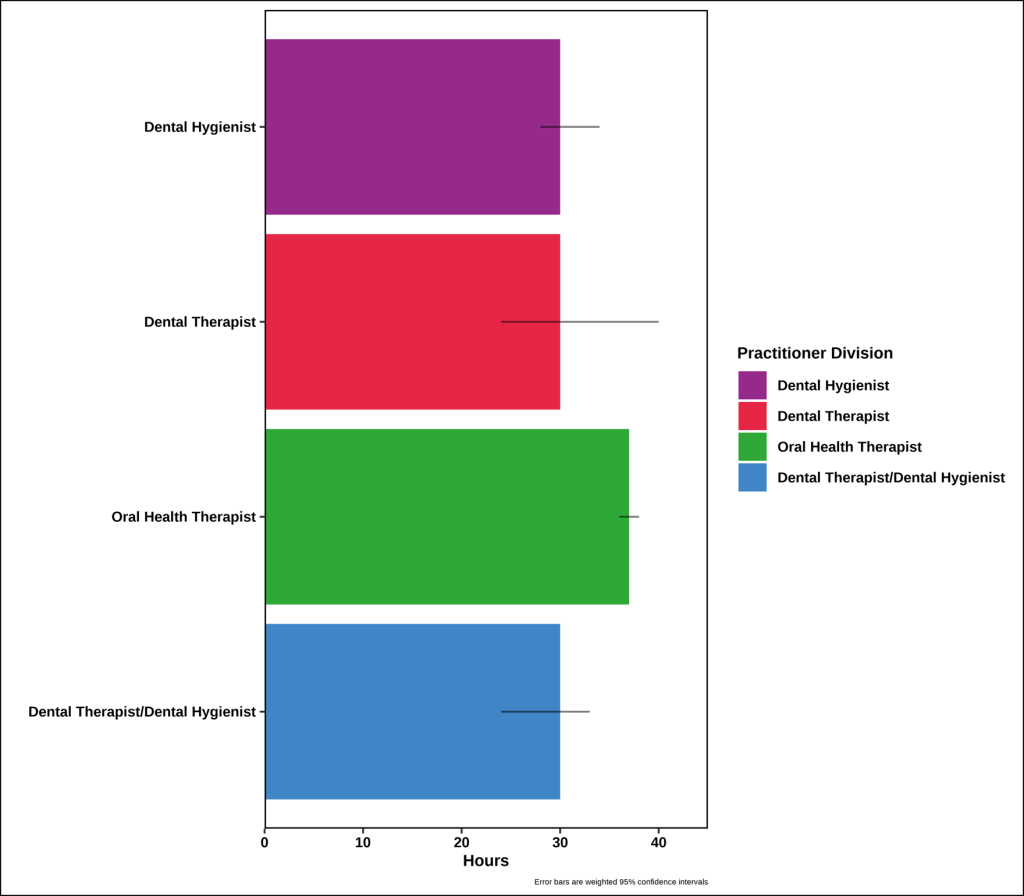
Table 10.1 Weighted oral health workforce average weekly usual number of hours worked by demographic characteristics.
|
|
Median number of hours |
|
|
Median (95% CI) |
|
Age (years) |
|
|
Less than 30 |
38 (38, 40) |
|
30 – 39 |
32 (30, 36) |
|
40 – 49 |
33 (32, 38) |
|
50 – 59 |
30 (28, 32) |
|
60 or more |
24 (20, 36) |
|
Gender |
|
|
Male |
38 (36, 40) |
|
Female |
33 (32, 36) |
|
State of primary practice |
|
|
34 (30, 38) |
|
|
32 (30, 38) |
|
|
35 (32, 38) |
|
|
35 (32, 38) |
|
|
35 (27, 40) |
|
|
32 (30, 38) |
|
|
Years practicing |
|
|
Less than 10 |
38 (38, 40) |
|
10-19 |
32 (32, 36) |
|
20-29 |
30 (26.5, 34) |
|
30 or more |
27(24, 30) |
Interpretation
The trends in the median number of weekly hours worked by the oral health workforce were indicatve of a predominantly female and established workforce. For example, the median number of weekly hours worked dropped from 38 hours in the age less than 30 years category to 32 hours in the 30-39 years age group. This can be partly explained by the oral health workforce being largely a female dominated profession and consistent with growing national trends in the proportion of new mothers being age 30 and older (Australian Institute of Family Studies 2022).
The large difference for males working more weekly hours than females reflect the oral health workforce being a female dominant profession. The differences between genders may be influenced by females taking maternity leave or parental responsibilities. The consistent and steadily decreasing median number of weekly hours worked by the oral health workforce according to the number of years of practice coincides with the likely increase in carer responsibilities within the female dominant profession, as well as those reaching towards the retirement age of approximately 65 years (Australian Bureau of Statistics 2024).
Sources
- Australian Institute of Family Studies. 2022. Maturing mums and fewer bubs. Facts and Figures. Accessed 09/08/2024. https://aifs.gov.au/research/facts-and-figures/births-in-australia
- Australian Bureau of Statistics. 2024. Retirement and Retirement Intentions, Australia. Accessed 09/08/2024. https://www.abs.gov.au/statistics/labour/employment-and-unemployment/retirement-and-retirement-intentions-australia/latest-release
Dental Therapists
Dental Hygienists
Oral Health Therapists
Queensland
South Australia
Western Australia
Confidence interval
New South Wales
Victoria
Tasmania
Australian Capital Territory
Northern Territory
