
13 Distribution by population
Christopher Sexton
Key Takeaways
This chapter reports the rate of OHPs relative to the Australian population. The key results include:
Distribution by population
There are 5052 total DTs, DHs, OHTs and other combinations of these categories in Australia. With an estimated population of 25.4 million Australian residents (Appendix Table 13.1), there are approximately 20.7 (95% CI 19.9, 21.6) OHPs per 100,000 residents nationwide.
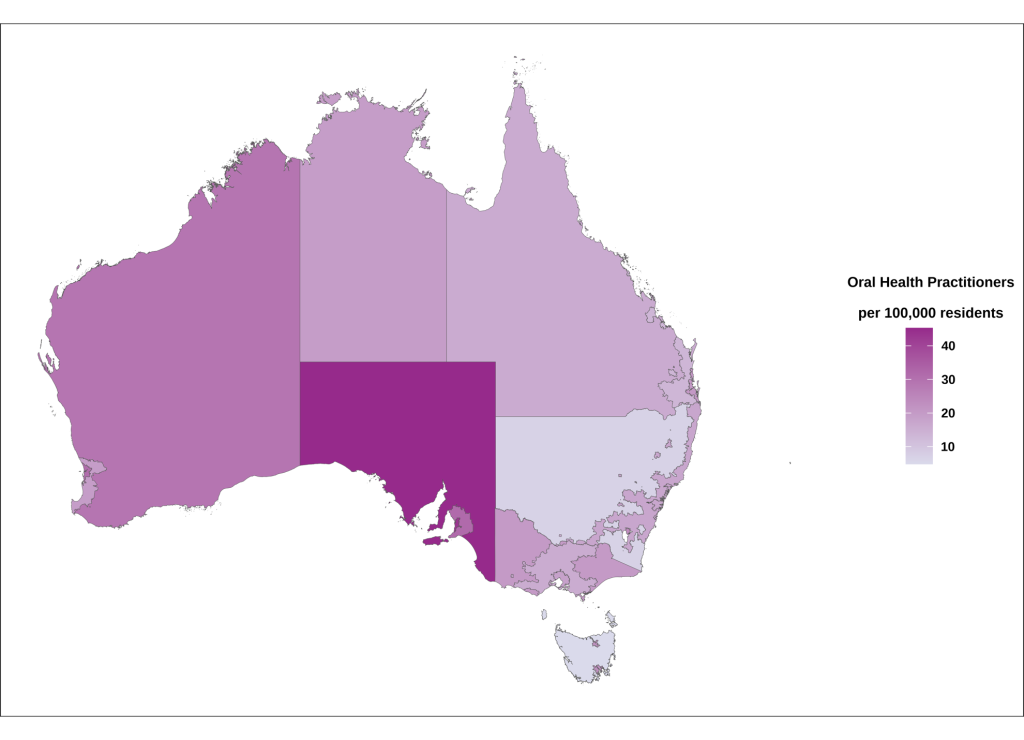
While most states have approximately 20 OHPs per 100,000, SA and WA have higher rates of practitioner to population with 42.3 and 29.7 practitioners per 100,000 population respectively (Figure 13.1). The number of practitioners per population in SA is more than twice the Australian rate per 100,000. TAS and NSW have the lowest rates of practitioners per 100,000 for all States and Territories.
The rate of practitioners per 100,000 residents across the regions in Australia is relatively uniform. It shows that the number of practitioners per resident is not affected by the region that a resident is located within. However, this does not account for differences that may occur beyond Outer Regional areas. Similarly, it does not account for the difference in area and population distribution that would affect access to OHPs and services in making comparisons between Major Cities and regional or remote areas. Despite an approximately constant rate by population at the national level, within NSW and TAS there was evidence that the distribution varies by region. However, these results should be interpreted with caution due to the small numbers of responses within these areas.
Figure 13.1 Rate of practitioners per population by state and geographical regions (Major Cities, Inner Regional, Outer Regional and further remote.
Rates of practitioners per population by gender show that there are far more female oral health practitioners than male practitioners across all regions in Australia (Table 13.1). Appendix Table 13.1 reports the unweighted number of repondents and weighted number of practitioners by region and demographic characteristics.
There is a weak relationship within the youngest age group (less than 30) where there is a higher rate of practitioners in Major cities than in more regional areas. This trend does not continue for other age groups. Practitioners that are 50 – 59 and 60+ years old have a higher rate of practitioners per population that work in Outer Regional and further remote locations than Major Cities.
There are higher rates of practitioners per population for DHs and OHTs in Major Cities than Outer Regional and further remote. Comparatively, the rate of DTs per population in Outer Regional and further remote areas (5.0) is twice the rate in Major Cities (2.4).
Table 13.1 Number of practitioners per 100,000 Australian residents by region and practitioner characteristics.
|
Practitioners per |
||||
|
All regions |
Major City# |
Inner Regional# |
Outer Regional |
|
|
Australia |
20.7 (19.9, 21.6) |
21.8 (20.2, 23.4) |
17.0 (12.6, 21.3) |
19.4 (12.3, 26.6) |
|
State |
|
|
|
|
|
16.9 (13.7, 20.2) |
17.4 (13.4, 21.4) |
17.7 (9.0, 25.8) |
6.8 (-6.0, 19.6)+ |
|
|
18.0 (14.3, 21.7) |
18.4 (14.0, 22.9) |
15.8 (6.7, 25.0) |
20.1 (-2.5, 42.8)+ |
|
|
18.6 (15.3, 21.9) |
20.6 (16.0, 25.3) |
13.5 (6.4, 20.6) |
16.1 (4.7, 27.5) |
|
|
42.3 (33.4, 51.2) |
43.1 (33.1, 53.1) |
31.7 (4.5, 58.8) |
45.3 (11.0, 79.7) |
|
|
29.7 (20.6, 38.8) |
30.9 (20.2, 41.6) |
19.1 (-7.3, 46.1)+ |
29.0 (-0.2, 58.3)+ |
|
|
15.8 (5.0, 26.6) |
– |
22.1 (5.8, 38.5) |
4.8 (-4.2, 13.8)+‑ |
|
|
23.8 (1.5, 46.1) |
23.8 (1.5, 46.1) |
– |
– |
|
|
19.4 (3.2, 35.6) |
– |
– |
19.4 (3.3, 35.5) |
|
|
Gender |
|
|
|
|
|
Female |
19.1 (18.1, 20.1) |
19.9 (18.2, 21.6) |
16.8 (12.5, 21.1) |
17.0 (10.0, 24.0) |
|
Male |
1.7 (1.1, 2.3) |
1.9 (1.2, 2.7) |
0.8 (-0.3, 1.9)+ |
1.2 (-1.1, 3.4)+ |
|
Age group (years) |
|
|
|
|
|
Less htan 30 |
5.2 (4.3, 6.2) |
5.9 (4.6, 7.1) |
3.8 (1.4, 6.1) |
3.2 (0.2, 6.1) |
|
30 – 39 |
7.4 (6.4, 8.4) |
7.5 (6.3, 8.8) |
7.3 (4.5, 10.1) |
6.6 (2.7, 10.5) |
|
40 – 49 |
3.7 (2.9, 4.5) |
3.8 (2.9, 4.8) |
4.3 (1.9, 6.6) |
1.8 (-0.1, 3.6)+ |
|
50 – 59 |
2.8 (2.1, 3.5) |
2.8 (1.9, 3.7) |
2.2 (0.6, 3.8) |
3.9 (0.9, 6.9) |
|
60+ |
1.6 (0.8, 2.4) |
1.8 (0.8, 2.9) |
– |
2.8 (-0.9, 6.5)+ |
|
Profession |
|
|
|
|
|
5.7 (4.8, 6.5) |
6.1 (5.0, 7.3) |
5.3 (2.9, 7.6) |
2.8 (0.6, 4.9) |
|
|
2.6 (1.7, 3.5) |
2.4 (1.3, 3.5) |
2.2 (0.3, 4.1) |
5.0 (0.3, 9.8) |
|
|
11.0 (9.9, 12.1) |
11.5 (10.0, 13.0) |
10.2 (6.7, 13.6) |
8.4 (4.0, 12.7) |
|
|
1.5 (0.9, 2.1) |
1.8 (1.0, 2.6) |
– |
2.0 (0.0, 4.0)+ |
|
|
# Multiple imputation of 56 from 414 respondents was used to increase responses due to missing postcode data. + Estimates based on responses less than 5. – Region not avaliable in the state or there were no respondents of these demographics in these regions. |
||||
Interpretation
Australia’s oral health work force require a strong mix of Dentist, Dental Prosthetists and OHPs to deliver dental services to Australians across all geographic regions. In 2022, Dentists fulfilled the largest working dental profession and were available at a rate of 62.0 practitioners per 100,000 population across Australia (Australian Institute of Health and Welfare, 2008). However, their numbers exist primarily in Major cities (69.5 per 100,000) compared to Outer regional (39.3 per 100,000) and beyond (20.5 per 100,000). Comparatively, our data shows that the distribution for the rate of OHPs per population is approximately evenly distributed across the regions of Australia. This suggests that OHPs have a larger role in providing care to Australians in Outer Regional and further remote areas.
SA has the highest rate of OHPs per population possibly reflecting the consistency and size of graduating classes from The University of Adelaide, the currently longest running OHT program. The higher rates of OHPs per population for WA will need to be interpreted cautiously due to the small number of respondents in the Outer Regional and further remote area. NT has a relatively strong OHP rate per population, as the NT rate of dentists per population (36.0 per 100,000) is only 60% of the Australian average (Australian Institute of Health and Welfare, 2008). The oral health work force for TAS is a cause for concern. Our report shows TAS currently have the lowest rate of OHP per population (15.8 per 100,000) and external data shows they are the second lowest for the rate of dentist per population (46.6 per 100,000) (Australian Institute of Health and Welfare 2008). This shortfall across the dental workforce needs to be addressed.
Within the oral health work force divisions, OHTs, DHs and DT/DHs have a mild increase in rates per population of working in Major Cities compared to Outer Regional and further remote areas. Comparatively, the trend is reversed for DT, with the highest rate per population for this profession occurring in Outer Regional and further remote areas.
While the current distribution of the oral health workforce is balanced across the regions of Australia, it is unclear whether this will continue into the future. Dental Therapists are generally older than other OHPs, and they are more likely to work in Outer Regional and further remote areas in a public dental role (Australian Government 2020). There are more OHTs than DTs per population in Outer Regional and further remote areas but overall, OHTs are more likely to work in private rather than public dental clinics (Australian Government 2020). As DTs reach retirement age in the coming years, Australians seeking public dental care in Outer Regional and further remote will require the possible void left by DTs to be filled by other oral health professions.
Sources
- Australian Institute of Health and Welfare. Oral health and dental care in Australia. Canberra, Australia; 2008 [updated 2024 October 2024; cited 2024 December 13]. Available from: https://www.aihw.gov.au/reports/dental-oral-health/oral-health-and-dental-care-in-australia/contents/dental-workforce
- Australian Government, Department of Health. Factsheet, Dental Hygienists 2019. Canberra, Australia; 2020 [updated 2021 January 1; cited 2024 December 13]. Available from: https://hwd.health.gov.au/resources/publications/factsheet-alld-dental-hygienists-2019.pdf
- Australian Government, Department of Health. Factsheet, Dental Therapists 2019. Canberra, Australia; 2020 [updated 2021 January 1; cited 2024 December 13]. Available from: https://hwd.health.gov.au/resources/publications/factsheet-alld-dental-therapists-2019.pdf
- Australian Government, Department of Health. Factsheet, Oral Health Therapists 2019. Canberra, Australia; 2020 [updated 2021 January 1; cited 2024 December 13]. Available from: https://hwd.health.gov.au/resources/publications/factsheet-alld-oral-health-therapists-2019.pdf
Oral health practitioner
Dental Hygienists
Oral Health Therapists
Dental Therapists
South Australia
Western Australia
Tasmania
New South Wales
Victoria
Queensland
Australian Capital Territory
Northern Territory
