
7 Principal place of employment
Nicole Stormon
Key Takeaways
This chapter reports the oral health workforce’s principal place of employment.
- 57% of OHPs principal place of employment was in the private sector.
- A third (33%) of public sector employment were aged 50 years and older.
- A higher proportion of males were employed in specialist services compared to other sectors.
Employment by division
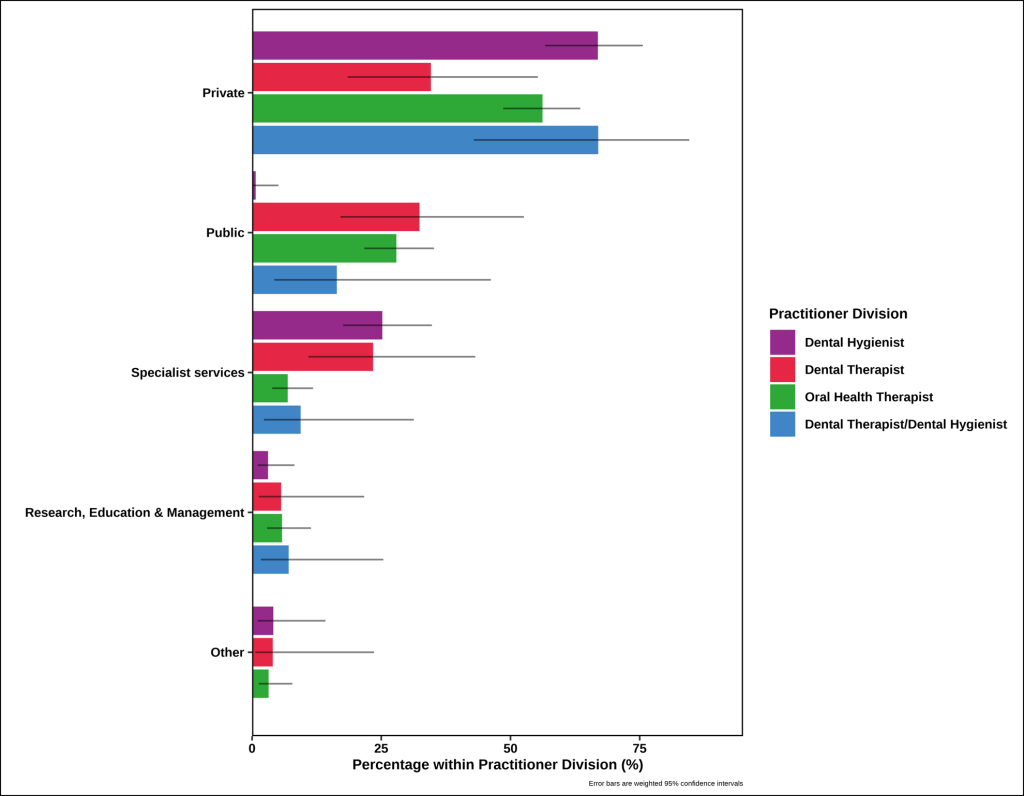
Figure 7.1. presents the proportions of the sector of principal place of employment by professional division. Over half (57.3%) of OHPs primary place of employment was in the private sector. Public sector was the primary sector of employment for 20.2%. Additionally, 14.0% and 5.2% in specialist services and Research, Education and Management respectively. The professions were largely similar, with the exception of DHs having only 1.0% in the public sector.
Figure 7.1. Weighted sector of principal place of employment by division.
Principal place of employment by demographics
Table 7.1. reports the characteristics of the oral health workforce principal place of employment by demographic characteristics. The unweighted characteristics of survey participants principal place of employment are reported in Appendix Table 7.1.
The oral health workforce employed in the private sector were predominantly less than 30 years of age (27.7%) and 30 – 39 years of age (38.8%). A higher proportion of the workforce employed in the public and research, education and management sectors were in the older age brackets (50 years of age and older).
The proportion of females within the private and public sectors were similar (92.5% and 93.5% respectively). There were a higher proportion of males within the specialist service (16.1%) and research, education and management roles (11.0%).
Table 7.1. Weighted characteristics of the oral health workforce principal place of employment.
|
|
Private |
Public |
Specialist services |
Research, Education & Management |
Other |
|
|
% (95% CI) |
% (95% CI) |
% (95% CI) |
% (95% CI) |
% (95% CI) |
|
Age (years) |
|
|
|
|
|
|
Less than 30 |
27.7 (21.5, 34.7) |
26.2 (16.8, 38.5) |
12.2 (5.0, 26.9) |
7.1 (1.0, 37.2) |
21.5 (4.8, 59.9) |
|
30 – 39 |
38.8 (32.2, 45.9) |
29.8 (20.0, 41.9) |
42.6 (28.8, 57.8) |
31.7 (13.8, 57.2) |
30.0 (8.8, 65.7) |
|
40 – 49 |
18.0 (13.2, 24.0) |
10.9 (5.7, 19.9) |
21.9 (12.3, 35.8) |
32.3 (13.9, 58.3) |
22.5 (5.1, 60.9) |
|
50 – 59 |
11.8 (8.1, 16.9) |
18.6 (11.0, 29.8) |
18.8 (9.6, 33.5) |
9.4 (2.8, 27.0) |
4.9 (0.6, 29.6) |
|
60 or more |
3.7 (1.5, 8.8) |
14.5 (5.7, 32.4) |
4.5 (1.0, 17.2) |
19.6 (4.3, 56.6) |
21.1 (3.1, 68.7) |
|
Gender |
|
|
|
|
|
|
Male |
7.5 (4.5, 12.2) |
6.5 (2.4, 16.4) |
16.1 (7.1, 32.4) |
11.0 (2.6, 36.0) |
14.7 (2.0, 58.8) |
|
Female |
92.5 (87.8, 95.5) |
93.5 (83.6, 97.6) |
83.9 (67.6, 92.9) |
89.0 (64.0, 97.4) |
85.3 (41.2, 98.0) |
|
State of primary practice |
|
|
|
||
|
27.9 (21.9, 34.9) |
22.0 (12.6, 35.4) |
18.8 (9.5, 33.6) |
49.5 (25.5, 73.7) |
38.1 (11.8, 74.0) |
|
|
22.3 (16.8, 28.9) |
26.4 (16.2, 39.9) |
15.5 (7.5, 29.4) |
18.1 (5.7, 44.4) |
14.8 (2.0, 59.0) |
|
|
14.4 (10.7, 19.2) |
24.1 (16.0, 34.6) |
19.8 (11.5, 32.0) |
18.2 (7.1, 39.5) |
18.1 (5.0, 47.8) |
|
|
16.3 (12.2, 21.5) |
8.5 (4.1, 16.5) |
12.0 (5.7, 23.7) |
14.2 (5.0, 34.6) |
0.0 (0.0, 0.0) |
|
|
16.5 (11.2, 23.8) |
8.6 (3.3, 20.7) |
28.6 (16.0, 45.8) |
0.0 ⁑ 0.0, 0.0) |
29.0 (7.4, 67.5) |
|
|
1.2 (0.4, 3.1) |
2.4 (0.6, 9.1) |
1.3 (0.2, 9.0) |
0.0 ⁑ (0.0, 0.0) |
0.0 ⁑ (0.0, 0.0) |
|
|
0.4 (0.1, 2.8) |
6.6 (1.7, 22.1) |
4.0 (1.3, 11.9) |
0.0 ⁑ (0.0, 0.0) |
0.0 ⁑ (0.0, 0.0) |
|
|
0.9 (0.2, 3.3) |
1.6 (0.5, 5.0) |
0.0 ⁑ (0.0, 0.0) |
0.0 ⁑ (0.0, 0.0) |
0.0 ⁑ (0.0, 0.0) |
|
|
Years practicing |
|||||
|
Less than 10 |
50.0 (42.9, 57.1) |
43.9 (31.9, 56.7) |
38.5 (25.1, 53.9) |
13.2 (3.3, 40.8) |
52.9 (20.8, 82.8) |
|
10-19 |
31.6 (25.5, 38.5) |
24.3 (15.6, 35.7) |
27.7 (16.6, 42.4) |
37.2 (17.7, 62.1) |
11.2 (2.5, 38.8) |
|
20-29 |
10.6 (7.0, 15.7) |
5.9 (2.0, 15.7) |
13.2 (6.1, 26.1) |
21.5 (7.5, 48.2) |
0.0 ⁑ (0.0, 0.0) |
|
30 or more |
7.8 (4.5, 13.2) |
26.0 (15.0, 41.1) |
20.6 (10.7, 36.0) |
28.0 (9.4, 59.5) |
35.8 (9.9, 73.9) |
Proportions were computed using weighted data.
⁑ Estimates equated to zero based on survey responses and weighting. However, there may be low numbers of actual practitioners in this group.
Interpretation
Employment patterns among OHPs across different sectors reflect broader trends within the dental workforce. The majority of OHPs were employed in the private sector, which aligns with existing literature indicating private practice being the predominant dental service provided within Australia. In contrast, the public sector employs a smaller, yet substantial proportion of the OHP workforce. This distribution of place of employment was similar to the previous survey conducted in 2020 of OHPs (Stormon et al. 2020).
The breakdown of principal place of employment by demographics highlights the private sector predominantly employs a younger workforce, while an older workforce is more commonly found in public and research and education roles. This distribution suggests younger professionals enter private practice, while established and experienced practitioners are within public or academic roles. This trend is consistent with literature indicating that public sector roles are often associated with job security, opportunities for professional development, and a structured work environment (Struber 2004). However, the lower employment numbers in the public sector may reflect challenges such as limited number of employment opportunities, lower earning potential compared to the private sector, and resource constraints which may affect job satisfaction (Hopcraft et al. 2010 and Silva et al. 2006). Research has highlighted that public sector positions may appeal more to experienced professionals seeking job stability or those committed to serving underserved populations, rather than to new graduates who might prioritise financial gain and rapid career progression (Hopcraft et al. 2010 and Silva et al. 2006).
A relatively large percentage of the total OHP workforce were employed in specialist services and roles within research, education, and management. There was a higher proportion of males in specialist and research roles. These positions are often composed of experienced practitioners who have focused their scope of practice to a specific oral health discipline, transitioning away from clinical practice, or seeking different forms of professional fulfilment. The relatively lower numbers in these sectors could be due to limited availability of such positions, the need for additional qualifications, or limited availability of opportunities.
As found in this study, the majority of OHPs are employed within clinical practice. Having opportunities for career development and diverse pathways is essential for career satisfaction and recognition (Chen et al. 2021). Further research and advocacy aimed at improving career progression opportunities, remuneration, and working conditions in the public sector could help attract and retain a more diverse and sustainable workforce. Continued research is needed to better understand the motivations and barriers influencing OHPs employment choices. This research could explore how different factors, such as financial considerations, worklife balance, and professional development opportunities, impact decisions to work in various sectors of the dental workforce.
Sources
- Chen D, Hayes M, Holden A. 2021. A global review of the education and career pathways of dental therapists, dental hygienists and oral health therapists. British Dental Journal. Apr;230(8):533-8.
- Hopcraft MS, Milford E, Yapp K, Lim Y, Tan V, Goh L, Low CC, Phan T. 2010. Factors associated with the recruitment and retention of dentists in the public sector. Journal of Public Health Dentistry. Mar;70(2):131-9.
- Silva M, Phung K, Huynh W, Wong H, Lu J, Aijaz A, Hopcraft M. 2006. Factors influencing recent dental graduates’ location and sector of employment in Victoria. Australian Dental Journal. Mar;51(1):46-51.
- Stormon N, Tran C, Suen B. 2021. Australian oral health workforce: the oral health professions workforce survey 2020.
- Struber JC. 2004. Recruiting and retaining allied health professionals in rural Australia: why is it so difficult?. Internet Journal of Allied Health Sciences and Practice. 2(2):2.
Oral health practitioner
Dental Hygienists
Confidence interval
New South Wales
Victoria
Queensland
South Australia
Western Australia
Tasmania
Australian Capital Territory
Northern Territory
