
11 Remuneration
Tan Nguyen
Key Takeaways
This chapter reports the characteristics of the OHP workforce on the median annual full-time income.
- The highest median annual full time income is $121,600 for OHPs working in research, education and management.
- The median annual full time income was lowest for OHPs whose principal place of practice was in the public sector at $93,000.
- There was a general trend for an increase in the median annual full time income for those that were older or with more years of practice experience.
Annual renumeration
Table 11.1 reports the median annual full time income according to categories of age, gender, state of primary practice, number of years of practice, and principal place of practice sector. The unweighted characteristics of survey participants for the median annual full time income are reported in Appendix Table 11.1.
The highest median annual full time income is $121,600 for the oral health workforce working in research, education and management. The second highest median annual full-time income of $115,000 reported by the oral health workforce were those with a practicing career length between 20-29 years, followed by the third highest median annual full time income being aged between 40-49 years at $112,500.
The lowest median annual full time income for the oral health workforce is $86,000 for those aged less than 30 years old. The second lowest median annual full-time income of $90,000 were the oral health workforce having less than 10 years of practice experience followed by those whose principal place of practice was in the public sector at $93,000.
There was a gradual increase in the median annual full-time income for the oral health workforce for those age less than 30 years at $86,000, which peaked at $112,500 for those aged 40-49 years old and reduced to $101,786 for those age older than 60 years.
The median annual full-time income for the oral health workforce ranged from $95,000 in SA to $108,571 in TAS, ACT and NT according to the state of primary practice.
Similar to the age category, the median annual full time income for the oral health workforce increased from $90,000 for less than 10 years of practice experience, which peaked at $115,000 for those have 20-20 years practice experience and reduced to $108,571 for those practicing for more than 30 years.
Figure 11.1. Median annual full-time income by profession
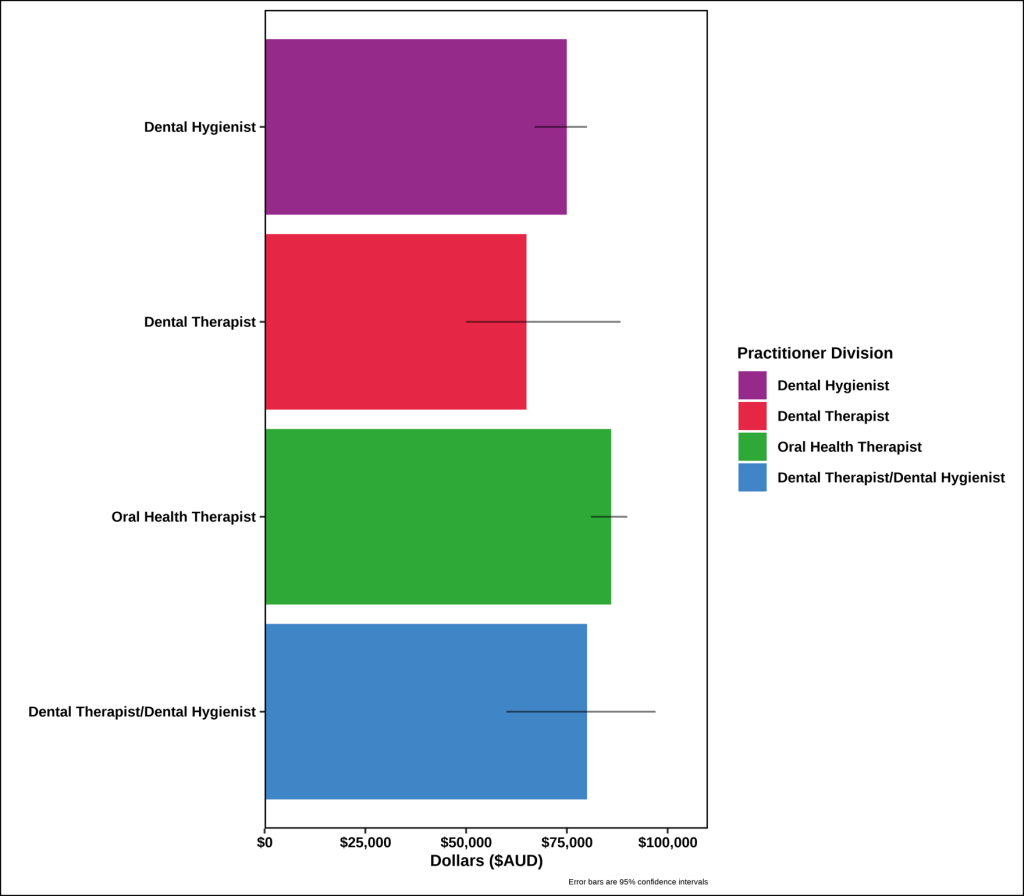
Table 11.1 Weighted oral health workforce average full time equivalent wage by demographics and practice sector characteristics.
|
|
Median |
(95% CI) |
|
Age (years) |
|
|
|
Less than 30 |
86000 |
(80000, 94486) |
|
30 – 39 |
101711 |
(95000, 106875) |
|
40 – 49 |
112500 |
(106400, 119429) |
|
50 – 59 |
105556 |
(100000, 112417) |
|
60 or more |
101786 |
(95000, 121600) |
|
Gender |
|
|
|
Male |
108571 |
(91200, 143784) |
|
Female |
100588 |
(97533, 104500) |
|
State of primary practice |
|
|
|
NSW |
100000 |
(95000, 108571) |
|
VIC |
100000 |
(93000,110000) |
|
QLD |
100000 |
(96000,106875) |
|
SA |
95000 |
(84444, 105119) |
|
WA |
105254 |
(91724,121037) |
|
TAS/ACT/NT |
108571 |
(98167,129057) |
|
Years practicing |
|
|
|
Less than 10 |
90000 |
(87292, 96000) |
|
10-19 |
106875 |
(104148,112500) |
|
20-29 |
115000 |
(102483, 129057) |
|
30 or more |
108571 |
(95000, 112417) |
|
Principal place of practice sector |
|
|
|
Private |
103,941 |
(100000, 108571) |
|
Public |
93,000 |
(87024, 98500) |
|
Specialist services |
101,786 |
(91412, 118560) |
|
Research, education and management |
121,600 |
(109000, 145000) |
|
Other |
105,000 |
(80000, 420000) |
Interpretation
The peak in the median annual full time income for the oral health workforce follows a similar trend for the age and number of years practice experience categories. This may be partly explained by more recent graduates are being trained and upskilled with the adult scope for restorative practice when compared to the older age cohorts and with longer years of practice experience.
Despite a female dominated profession, there is limited evidence that a gender equity gap exists. Males reported a higher mean annual full time income of $108,571 when compared to females with $100,588. Although there were low number of males in the profession and survey, which limits the strength of the avaliable evidence.
The oral health workforce from the largest three states of primary practice, NSW, VIC and QLD reported the same median annual full time income of $100,000. The higher median annual full time income of $108,571 for TAS, ACT and NT could be partly explained by potentially higher rural and remote incentives for health professionals to service these geographic regions.
The median annual full time income for the oral health workforce was lowest for OHPs whose principal place of practice was in the public sector at $93,000. Interestingly, the median annual full time income for those working in specialist services at $101,786 was lower than private practice at $103,951. This may be due to a narrow scope of practice being utilised by the oral health workforce in specialist services or due to the lower qualification levels of DH‘s who predominantly work in these areas. The highest median annual full time income was reported for those working in research, education and management, which would be consistent for the likelihood that these roles require a more experienced and higher qualified oral health workforce. Where the principal place of practice was reported in the ‘Other’ category, the median annual full time income of $105,000 had the largest 95% confidence interval. The upper 95% confidence interval of $420,000 for this category would suggest a small number of the oral health workforce are employed in very high paying positions, such as senior executive leadership.
Oral health practitioner
South Australia
Tasmania
Australian Capital Territory
Northern Territory
New South Wales
Victoria
Queensland
Dental Hygienists
