
8 Secondary place of employment
Nicole Stormon
Key Takeaways
This chapter reports the characteristics of respondents’ secondary place of employment.
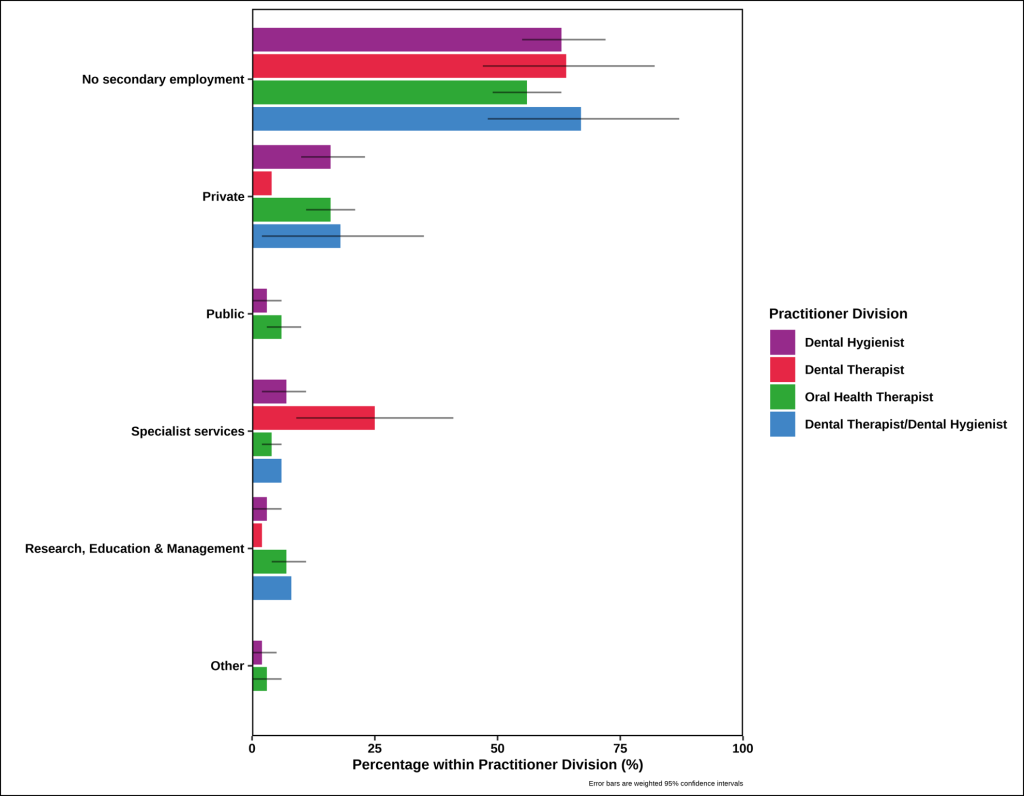
- Two-thirds of OHP’s did not have secondary place of employment.
- There was a high proportion of younger practitioners working in public practice as secondary employment.
Secondary place of employment
Figure 8.1. presents the weighted percentages of the sector of secondary place of employment by professional division. Two-thirds of OHP’s did not have secondary place of employment. Those that did report secondary employment were more often in the private and specialist service sector. Appendix Table 8.1 reports the unweighted characteristics of survey participants secondary place of employment.
Figure 8.1. Weighted sector of secondary place of employment by division
Secondary place of employment by demographics
Table 8.1. reports the characteristics of those with a secondary place of employment. For those with a secondary place of employment, there was a higher proportion of those younger than 39 years of age (59.4%) in private practice than older age groups. Public sector secondary employment had a high proportion of those less than 30 years of age (60.8%). Age followed a similar trend amongst private and public practice as a secondary place of employment.
Table 8.1. Weighted characteristics of the oral health workforce secondary place of employment.
|
|
Private |
Public |
Specialist |
Research, Education & Management |
Other |
|
|
% (95% CI) |
% (95% CI) |
% (95% CI) |
% (95% CI) |
% (95% CI) |
|
Age (years) |
|
|
|
|
|
|
Less than 30 |
22.9 (13.5, 36.0) |
60.8 (35.8, 81.2) |
12.2 (4.4, 29.5) |
26.4 (11.5, 49.9) |
67.5 (32.9, 89.8) |
|
30 – 39 |
36.5 (25.4, 49.2) |
21.6 (7.7, 47.4) |
34.6 (18.1, 55.8) |
26.6 (12.1, 48.8) |
7.9 (1.0, 42.1) |
|
40 – 49 |
19.2 (11.3, 30.6) |
9.5 (2.1, 34.1) |
31.6 (16.1, 52.7) |
27.8 (13.1, 49.8) |
7.2 (0.9, 39.9) |
|
50 – 59 |
19.1 (10.9, 31.3) |
8.1 (1.9, 28.8) |
12.9 (3.6, 36.5) |
7.9 (2.5, 22.8) |
17.5 (3.8, 53.4) |
|
60 or more |
2.4 (0.3, 15.2) |
0.0 (0.0, 0.0) |
8.8 (1.3, 42.1) |
11.2 (3.3, 31.8) |
0.0 (0.0, 0.0) |
|
Gender |
|
|
|
|
|
|
Male |
16.4 (8.7, 28.8) |
14.1 (3.2, 45.1) |
16.4 (5.2, 41.1) |
4.8 (0.7, 27.6) |
0.0 ⁑ (0.0, 0.0) |
|
Female |
83.6 (71.2, 91.3) |
85.9 (54.9, 96.8) |
83.6 (58.9, 94.8) |
95.2 (72.4, 99.3) |
100.0 (100.0, 100.0) |
|
State of primary practice |
|||||
|
23.5 (14.1, 36.4) |
11.7 (2.8, 37.9) |
15.5 (5.7, 35.9) |
31.8 (15.3, 54.7) |
15.5 (2.1, 61.1) |
|
|
20.7 (11.9, 33.6) |
40.1 (18.8, 65.9) |
25.3 (11.5, 46.9) |
22.0 (8.6, 45.9) |
10.9 (1.4, 51.2) |
|
|
14.5 (8.3, 24.1) |
6.3 (1.5, 23.4) |
23.9 (11.8, 42.3) |
20.7 (9.6, 39.2) |
17.3 (3.8, 52.4) |
|
|
23.6 (15.2, 34.7) |
7.1 (1.6, 25.9) |
18.0 (6.3, 41.7) |
13.4 (5.3, 30.0) |
13.8 (3.0, 45.3) |
|
|
14.2 (6.6, 28.0) |
34.8 (14.3, 63.2) |
14.9 (3.9, 43.1) |
12.1 (3.0, 37.4) |
42.5 (12.6, 79.2) |
|
|
2.1 (0.5, 8.3) |
0.0 ⁑ (0.0, 0.0) |
0.0 ⁑ (0.0, 0.0) |
0.0 ⁑ (0.0, 0.0) |
0.0 ⁑ (0.0, 0.0) |
|
|
1.4 (0.2, 9.2) |
0.0 ⁑ (0.0, 0.0) |
2.3 (0.3, 15.2) |
0.0 ⁑ (0.0, 0.0) |
0.0 ⁑ (0.0, 0.0) |
|
|
0.0 ⁑ (0.0, 0.0) |
0.0 ⁑ (0.0, 0.0) |
0.0 ⁑ (0.0, 0.0) |
0.0 ⁑ (0.0, 0.0) |
0.0 ⁑ (0.0, 0.0) |
|
|
Years practicing |
|||||
|
Less than 10 |
48.6 (36.2, 61.1) |
75.7 (50.5, 90.5) |
38.8 (21.4, 59.6) |
51.5 (31.2, 71.3) |
81.8 (45.6, 96.0) |
|
10-19 |
27.3 (17.8, 39.5) |
13.2 (3.3, 40.7) |
22.2 (9.8, 42.9) |
27.0 (12.7, 48.6) |
7.2 (0.9, 39.9) |
|
20-29 |
13.8 (7.0, 25.3) |
6.3 (1.5, 23.4) |
6.9 (1.7, 24.3) |
13.4 (4.7, 32.9) |
10.9 (1.4, 51.2) |
|
30 or more |
10.3 (4.5, 22.1) |
4.7 (0.6, 27.8) |
32.1 (15.1, 55.7) |
8.0 (1.8, 29.6) |
0.0 ⁑ (0.0, 0.0) |
Proportions were computed using weighted data.
⁑ Estimates equated to zero based on survey responses and weighting. However, there may be low numbers of actual practitioners in this group.
Interpretation
The findings in this chapter are similar to previous workforce reports on OHPs (Stormon et al. 2020). This chapter highlights a trend where younger OHPs are more likely to engage in secondary employment, particularly in private and specialist sectors. This phenomenon could be influenced by several factors. Younger OHPs may be more inclined to seek additional employment to gain experience in the public sector where scope of practice may be more diversely utilised and provide professional networks and support. Literature on early career development supports this, indicating that younger professionals are generally more proactive in seeking supplementary roles to advance their careers (Nash et al. 2014).
Mid-career OHPs engaging in secondary employment within private and specialist practice may reflect a strategic approach to balancing family commitments as well as the availability of part-time roles within these sectors.
Sources
- Nash DA, Friedman JW, Mathu-Muju KR, Robinson PG, Satur J, Moffat S, Kardos R, Lo ECM, Wong AHH, Jaafar N, van den Heuvel J, Phantumvanit P, Chu E, Naidu R, Naidoo L, McKenzie I, Fernando E. 2014. A review of the global literature on dental therapists. Community Dentistry and Oral Epidemiology, 42: 1–10.
- Stormon N, Tran C, Suen B. 2021. Australian oral health workforce: the oral health professions workforce survey 2020.
Oral health practitioner
Confidence interval
New South Wales
Victoria
Queensland
South Australia
Western Australia
Tasmania
Australian Capital Territory
Northern Territory
