
9 Types of employment
Jennifer Gray and William Carlson-Jones
Key Takeaways
This chapter reports the proportion of full time and part time oral health practitioners.
- All practitioner groups are predominantly in permanent employment.
- A higher proportion of DTs (20%) and dual qualified practitioners (13%) are self-employed or business owners.
- A higher proportion (67%) of younger oral health practitioners work full time.
type of employment
Figure 9.1 reports the type of employment by division. DHs predominantly work permanent part time (42%) with similar percentages working in full time permanent positions (23%) and casual employment (22%). DTs predominantly work in permanent full time (28%) and permanent part time (28%); with 20% as self-employed or business-owners. Dual qualified DT/DH practitioners predominantly work part time permanent employment (62%). One fifth of DHs (22%), OHTs (21%) and dual qualified DT/DH (21%) work in a casual capacity. Only a small percentage of practitioners work as a locum with 2% of both the DTs and DHs and 4% of the dual-qualified DT/DH.
Appendix Table 9.1. Reports the unweighted characteristics of survey participants employed full and part time.
Figure 9.1. Weighted type of employment contract by division.
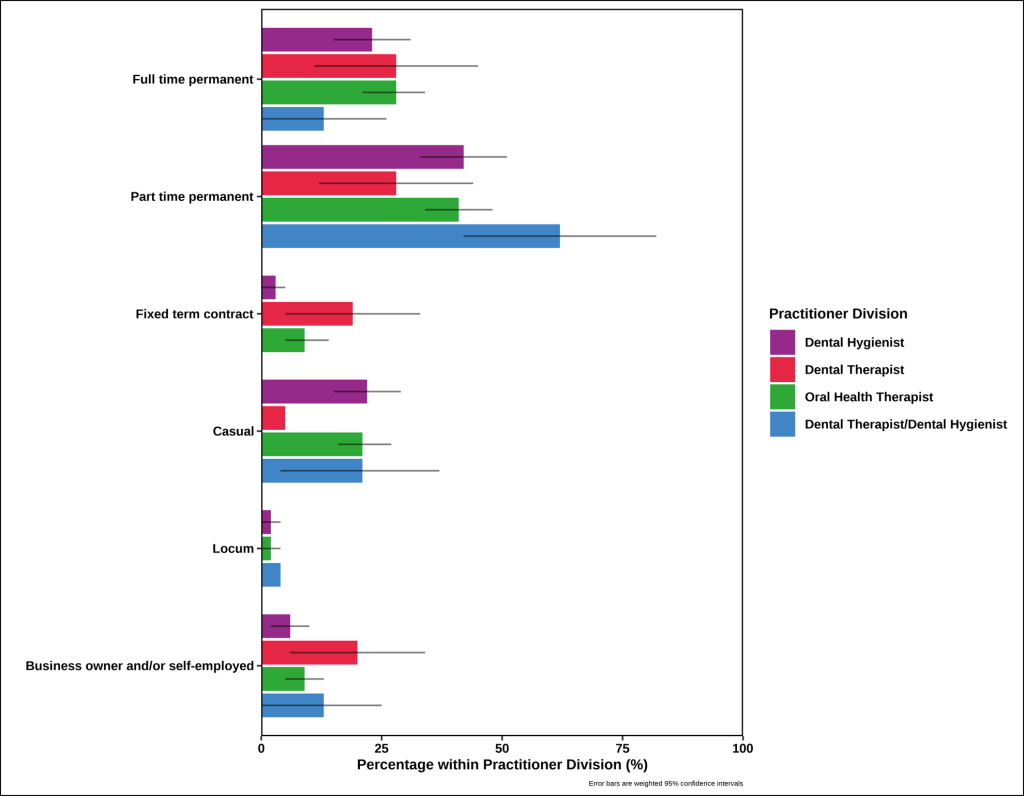
Table 9.1 reports the weighted characteristics of the oral health workforce employed full and part time. The unweighted characteristics of survey participants employed full and part-time are reported in Appendix Table 9.1.
The majority of the oral health workforce were employed part time. The younger (aged less than 30 years) and those aged over 60 years were more evenly distributed across part time and full time employment. In the other age groups there was at least twice the proportion of OHTs working part time.
Two-thirds of the male oral health workforce were in full time employment (67%), whereas approximately two-thirds of the females were employed part time.
There was variation between the states in the proportion of the oral health workforce that were employed full or part time. The ACT was the only state that reported a higher proportion working full time (83%). QLD had an even distribution between full time and part time employment. Approximately three quarters of the oral health workforce in both WA and TAS were employed in a part time capacity.
The OHPs with less than 10 years experience are more evenly distributed between full time and part time employment while two thirds of those with 10-29 years experience are employed part time.
All divisions of the oral health workforce had a higher proportion of practitioners working part time, although DTs were more equally employed across both part time and full time.
Table 9.1. Weighted characteristics of the oral health workforce participants employed full or part-time. Excludes all other employment types.
|
|
Full time |
Part time |
|
|
% (95% CI) |
% (95% CI) |
|
Age (years) |
|
|
|
Less than 30 |
49.2 (36.3, 62.2) |
50.8 (37.8, 63.7) |
|
30 – 39 |
38.0 (28.6, 48.4) |
62.0 (51.6, 71.4) |
|
40 – 49 |
30.8 (19.6, 44.9) |
69.2 (55.1, 80.4) |
|
50 – 59 |
26.5 (15.5, 41.5) |
73.5 (58.5, 84.5) |
|
60+ |
44.9 (16.7, 76.8) |
55.1 (23.2, 83.3) |
|
Gender |
|
|
|
Male |
67.3 (42.4, 85.1) |
32.7 (14.9, 57.6) |
|
Female |
35.8 (29.6, 42.4) |
64.2 (57.6, 70.4) |
|
State of primary practice |
|
|
|
40.4 (28.3, 53.7) |
59.6 (46.3, 71.7) |
|
|
33.4 (22.5, 46.4) |
66.6 (53.6, 77.5) |
|
|
50.1 (36.9, 63.3) |
49.9 (36.7, 63.1) |
|
|
43.0 (29.1, 58.2) |
57.0 (41.8, 70.9) |
|
|
23.3 (11.4, 41.8) |
76.7 (58.2, 88.6) |
|
|
29.2 (7.2, 68.5) |
70.8 (31.5, 92.8) |
|
|
82.9 (45.1, 96.6) |
17.1 (3.4, 54.9) |
|
|
35.1 (6.3, 81.3) |
64.9 (18.7, 93.7) |
|
|
Years practicing |
|
|
|
Less than 10 |
46.1 (37.0, 55.4) |
53.9 (44.6, 63.0) |
|
10-19 |
29.1 (20.4, 39.7) |
70.9 (60.3, 79.6) |
|
20-29 |
28.5 (12.9, 51.7) |
71.5 (48.3, 87.1) |
|
30 or more |
37.9 (21.6, 57.5) |
62.1 (42.5, 78.4) |
|
Practitioner division |
|
|
|
35.9 (25.6, 47.7) |
64.1 (52.3, 74.4) |
|
|
49.7 (27.2, 72.3) |
50.3 (27.7, 72.8) |
|
|
40.5 (32.5, 49.0) |
59.5 (51.0, 67.5) |
|
|
17.6 (6.3, 40.7) |
82.4 (59.3, 93.7) |
‡ Practitioners with other combinations of oral health registrations division were grouped and should be interpreted with caution.
Interpretation
The majority of OHPs were employed in a permanent capacity, either full or part time. There has been a comparative increase in the proportion of DH (8%) and DT (6%) that have full time permanent employment compared with the previous 2020 report resulting in a reduction in part-time employment (Stormon et al. 2020). Conversely, OHTs have a 5% reduction in the proportion of practitioners in full time permanent employment (Stormon et al. 2020). Across all categories of OHPs, 25-30% work in fixed term or casual employment. The higher proportion of part time work may reflect the fact that there are limited opportunities for full time employment. Opportunities may exist in areas with higher needs and lower proportion of practitioners.
TAS and NT have very low numbers of OHPs and the lowest FTE per population (AIHW 2024), while having poorer oral health (Do and Spencer 2016). Those people living in regional and remote areas have poorer oral health and reduced access to dental and oral health practitioners than metropolitan areas (AIHW 2024, Do et al. 2016, AIHW 2024). There may be an opportunity to create workforce incentives for these areas; to offer more full time employment to entice more OPHs to work in the disadvantaged areas. Research indicates that dentists are more likely to offer full time employment in areas of high oral health needs (Kempster et al. 2015).OPH
There has been an increase in the number of OHPs that are self-employed or business owners across all categories since the 2020 workforce report with a two-fold increase for DH, five-fold increase for DT and nine-fold increase for OHT (Stormon et al. 2020). This may be evidenced by the fact that these practitioner groups are more experienced (2024 Table 3.1.2; Stormon et al 2020) or practitioners who have previously expressed interest in expanding scope, independence and managerial responsibilities (Chen et al. 2021).
The OHP role and independent practice has developed and may have influenced the diversity and type of work undertaken by OHPs, increasing the use of the oral health workforce broadened the skill mix (Gallagher et al. 2024). More experienced OHPs may consider a transition from full time clinical practice to alternate contributions to the profession in areas such as teaching, mentoring, tutoring, management, healthcare or administration. There are opportunities for task sharing in areas of innovation and rehabilitation across the life course; innovative workforce models and integration with primary health care (Gallagher et al. 2024).
Sources
- Australian Institute of Health and Welfare. National Health Workforce Dataset, Allied Health Dental Practitioners, 2013-2022: 2024 http://www.aihw.gov.au
- Australian Institute of Health and Welfare. Oral health and dental care in Australia 2024
- Chen D, Hayes M, Holden A. A global review of the education and career pathways of dental therapists, dental hygienists and oral health therapists. British Dental Journal. 2021 Apr;230(8):533-8.
- Do LG & Spencer AJ (editors) 2016. Oral health of Australian children: the National Child Oral Health Study 2012–14. Adelaide: University of Adelaide Press.
- Gallagher JE, Grazielle CM Savage, Crummey SC, Sabbah W, Makino Y, Varenne B. Health workforce for oral health inequity: Opportunity for action. 2024 June 1-18
- Kempster C, Luzzi L, Roberts-Thomson K. Australian dentists: characteristics of those who employ or are willing to employ oral health therapists. Australian Dental Journal Vol 60 Issue 2 2015: 154-162
- Stormon N, Tran C, Suen B. Australian oral health workforce: the oral health professions workforce survey 2020.
Dental Therapists
Dental Hygienists
Oral Health Therapists
Australian Capital Territory
Queensland
Western Australia
Tasmania
Oral health practitioner
Confidence interval
New South Wales
Victoria
South Australia
Northern Territory
Full time equivalent
