
In Chapter 8 on bank financial statements, we showed how write-off of loans and depreciation of securities decrease the equity of a bank, through either its accumulated retained profits component or its capital reserve component. We have also studied that if a bank had been cautious in building up lending provisions in anticipation to a write off, this would have similarly decreased equity, but simply earlier than the write-off itself and in a staggered manner. A fundamental question is whether the bank has initially enough equity not only to sustain that loss but also to have some equity left. From a legal perspective, any company needs a positive amount of equity to be authorised to continue business. Banks are subject to even stricter rules around equity and regulatory capital (a concept closely related to accounting equity but with a slightly different definition). Bank capital adequacy regulation is a type of regulation aiming at obliging banks to have sufficient capital ex-ante to be able to survive the loss induced by asset reduction. The regulation takes the form of a minimum requirement on regulatory capital expressed as a certain percentage of the assets or as a certain percentage of a risk adjusted measure of these assets. International agreements coordinated by the Bank of International Settlement, known as Basel Accords, provide the rules and standards to national regulators when they design their domestic capital adequacy regulation. These international standards guarantee a certain convergence in rules around the world. This chapter is presenting the regulation in the context of Australia, elaborated and implemented by the Australian Prudential Regulation Authority (APRA), which is known for adopting the international rules fast and conservatively, usually without the transitional or phase-in arrangements that the Basel rules allow. There are a few differences among countries, of course, but, nevertheless, the main principles described in this chapter apply to all 28 jurisdictions represented in the Basel Committee for Banking Supervision at the Bank of International Settlement, including the United States of America, the European Union and the United Kingdom. We present the rules as they apply to Australia after the reform of Basel III, some aspects of this reform due to implementation from January 2023. We will occasionally refer to the previous arrangements, Basel I and Basel II, when it helps understand the rationales of the new features of Basel III accord.
The structure of this chapter is as follows:
- Rationales for capital adequacy regulation
- The main principles
- The measurement of regulatory capital and risk weighted assets
- The conservation and countercyclical buffers
-
Rationales for capital adequacy regulation
As bank capital regulation imposes banks to hold equity, we first need to understand in depth the role played by equity and the benefits of having enough of it.
1.1 The role of equity in absorbing a reduction in assets
With equity absorbing totally or partially a reduction in assets, capital regulation has both a preventive purpose by reducing the occurrence of bankruptcy and a protective purpose by protecting creditors if bankruptcy realises.
If there is enough equity, in the event of a write-off or depreciation of assets, the decrease in equity that results from the decrease in assets will not bring equity to a negative value, allowing thereby the bank to avoid insolvency and keep operating. In the unfortunate case where the shock is of such large magnitude that equity goes negative and the bank must close business, creditors, i.e. all parties that own assets that are liabilities of the bank, will be able to receive a part of the proceeds of the sale of the assets larger than otherwise.
Let’s illustrate this dual purpose with the initial state of a simplified bank balance sheet before a shock.
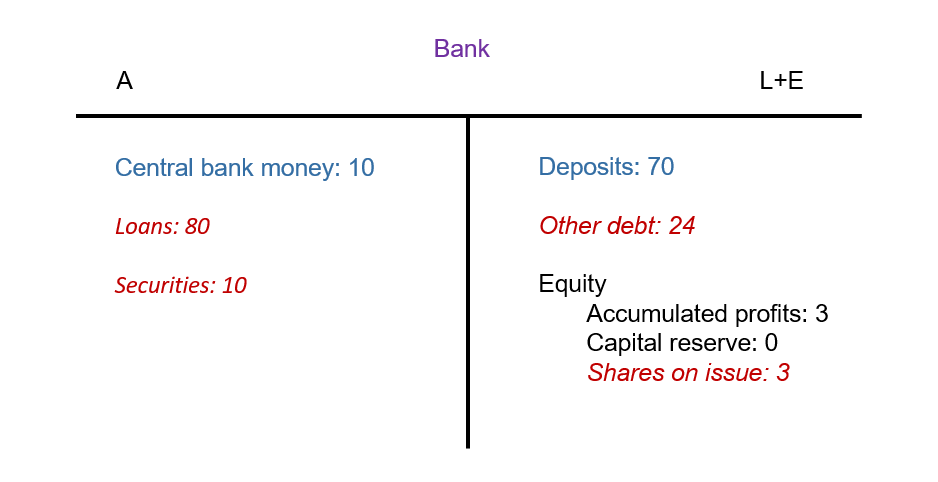
Following a 4 million write-off of loans and a 1 million market depreciation of available-for-sale securities, the bank survives as it had enough equity to absorb the loss; even though some components of equity went negative such as accumulated profits or capital reserve, the total amount of equity remained positive after absorbing the loss, as shown below.
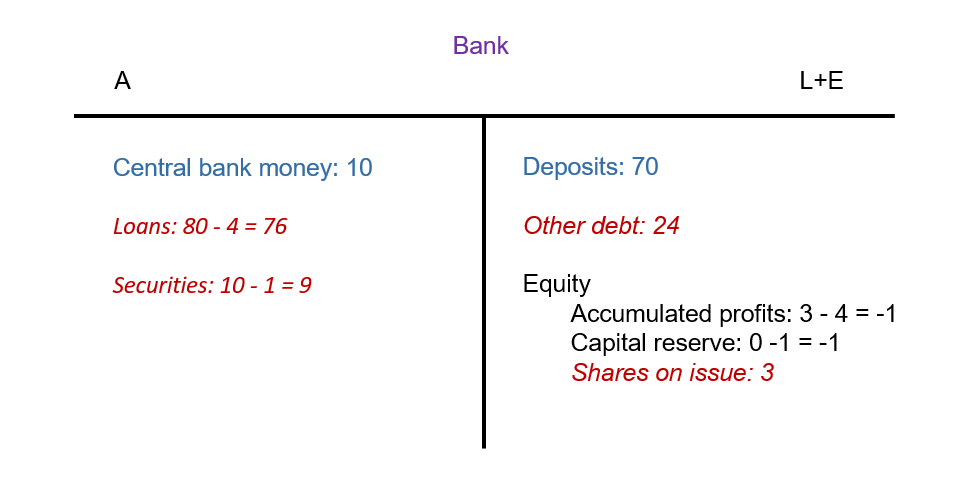
There was enough equity to fully absorb the loss and stay at a positive value after recording the loss. Even though both accumulated profits and capital reserve went negative at -1 million, overall equity remained positive at 1 million (-1 -1 +3 =1 >0). That was possible thanks to the existing amount of shares on issue, also a component of equity. Even though, technically speaking, the accumulated profits and the capital reserve are the only components that really absorb the shock on assets, the existence of shares on issue offsets the negative values of the other components of equity and keeps equity positive and therefore maintains bank solvency. Equity, even its not absorbing component, had therefore a preventive role by avoiding bankruptcy.
If the shock had a larger magnitude, say 5 million write-off and 2 million market depreciation, the total equity would turn negative (-2 -2 +3 =-1 <0); the bank would become insolvent and the liquidators would need to sell the bank assets to repay the creditors.
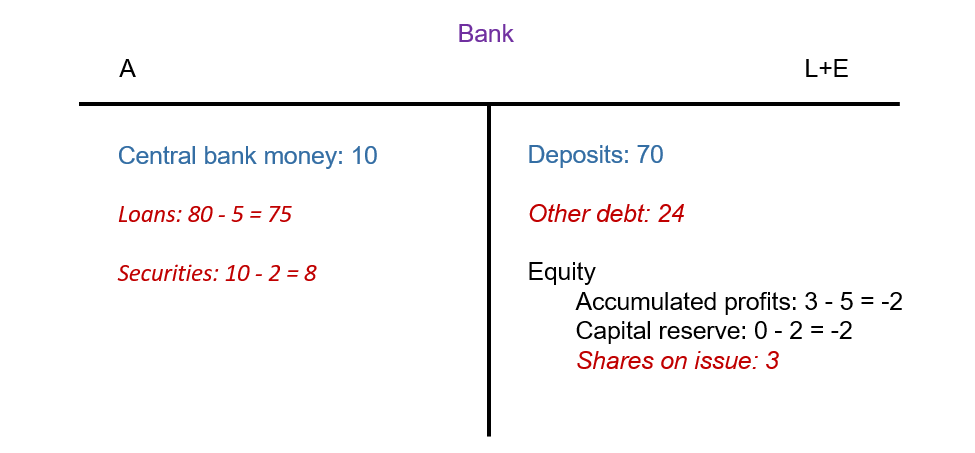
Still, the bank creditors are better off than in the case without initial equity: the bank liabilities exceed the assets only by 1 instead of 7 million (in the case we started with 0 equity). Creditors get back a larger portion of their investment once the assets are liquidated. This story illustrates the protective role of equity on creditors once bankruptcy realises.
As equity is not an asset, it is a mistake to visualise equity as a pot from which the bank takes out money to give to creditors. Equity absorbed the loss protecting creditors but not paying creditors. That is an important distinction that is often a source of confusion for students and the public. Creditors can only be paid with the proceeds of the assets that have been sold after bankruptcy.[1]
Also although it is true that equity always equals assets minus liabilities, that difference does not capture the essence of equity, better apprehended through its components. As can be seen in the example above, equity did not decrease because the difference decreased (even though it did) but because a loss has affected accumulated profits and a depreciation in market value has affected capital reserves. As we have insisted since chapter 2, it is more informative to approach equity from the perspective of its components rather than as a residual.
1.2 Why do we need capital adequacy regulation and international capital adequacy standards?
Maintaining enough capital in case it is lost during asset reduction is costly, in terms of its repercussions on shareholders. It requires to issue new shares, which results in capital dilution, or to retain profits, which limits the distribution of dividends. Both dilutions and lower dividends are not appreciated by the bank’s shareholders.
In the absence of regulation, banks would tend to not hold enough capital as they would be subject to the shareholders’ pressures and would not account for the externalities of the bankruptcy on the wellbeing of society and the knock-on effects on the financial system and possibly the real economy. Capital regulation is a mechanism to force them to hold more capital than what they would spontaneously choose if they were free. Banks have an incentive to locate in countries where the capital regulation is less constraining. The capital regulation needs therefore to be international so no country has an incentive to lower their regulatory requirements to attract banks, which would trigger a race towards lower standards, ending up in banks in the world becoming more fragile to shocks on their assets and creditors being at the mercy to lose their investment.
The Basel Accords are a succession of international rules on capital regulation, to which the 28 countries that are members of the group must adhere by incorporating these rules into their national regulations. The first agreement Basel Accord (later renamed Basel I to distinguish it from its successor) dates back to 1988. The main change to the practices of the time was to impose a minimum requirement on regulatory capital as a % of risk weighted assets (as opposed to total assets, as used to be the case in the UK or in the US) to take into account the probability of default of the assets. Basel II accord (2004) was a refinement of the original one in the way to calculate the risk weight of the assets. Basel III (2010) amended Basel II by raising the capital requirements to address the lack of capital that became apparent during the global financial crisis and introducing conservation and countercyclical buffers to combat the procyclical effect of minimum requirements. The reformed Basel III agreement (2017), sometimes informally referred to as Basel 3.1 or even Basel IV, is complementing the original Basel III framework. We will revisit each of these major changes when relevant in our discussion.
2. General principles
We present the most recent rules of the reformed Basel III , as they will apply to Australian ADIs from January 2023.
2.1 Minimum requirements on capital ratios
The minimum requirement regulation imposes that the capital ratio of a bank, defined as the ratio of regulatory capital over risk-weighted assets, be above a certain threshold, called the minimum capital ratio.

Note that  signals a definition, as opposed to an equilibrium condition. The capital ratio is defined by a ratio where at the numerator we have a measure of regulatory capital that is close but slightly different from the definition of accounting equity seen in the previous section and at the denominator we have a measurement of the assets, each class of assets weighted by a coefficient (risk weight) reflecting the credit risk of that class of assets. Section 3 provides the technical details of these concepts. The capital ratio on the left hand side of the requirement is measured using the actual data extracted from the bank’s balance sheet. The right hand side term is an external requirement imposed by Basel III regulation. Depending on the definition of the regulatory capital – Common equity tier 1 (CET1), Tier 1 or total capital – used at the numerator of the capital ratio the requirement on the right hand side is different.


The definition of regulatory capital goes from very narrow CET1, even smaller than accounting equity, to very large total capital, larger than accounting equity, embedding some liabilities as well. That is why the minimum requirement on the right hand side increases with the scale of the definition used.
All these requirements need to be met simultaneously. Breaching one of the three requirements would be enough for not complying with the regulation overall.
In addition to the minimum requirements on risk weighted assets, Basel III imposes a minimum on total assets for certain banks that we will characterize later.

Be aware that the definition of leverage ratio used by regulators does not match the definition commonly used in corporate finance (where it is measured as debt over equity).
Because CET1 capital is part of Tier 1 capital and Tier 1 capital is a component of Total capital, you have some components that are in a way “reused” to meet several requirements. Typically CET1 capital is counted in the CET1 ratio, in the Tier 1 ratio, in the Total Capital and in the Leverage ratio. Tier 2 capital, however, is counted only once in the Total Capital ratio.
2.2 Reformulating the requirements in terms of required regulatory capital
We can rewrite the equation

as

We have simply multiplied each side of the inequality by 
Instead of comparing the actual ratio to the minimum ratio, we compare the regulatory capital in the balance sheet with the required minimum capital as calculated given the actual risk weighted assets in the balance sheet and the ratio imposed by the regulator.


The formulations of the requirements in 2.1 and in 2.2 are absolutely equivalent.
In regulation documents and in the profession, RWA is used as a short cut for risk weighted assets. We will use RWA for the rest of the chapter.
2.3 Checking compliance and punishment
As mentioned earlier, all requirements must be met simultaneously.
There are two ways to check that a bank is compliant. The first method is to calculate the 4 capital ratios using the actual data from the bank’s balance sheet and check that each of them is higher with the relevant minimum ratio. The second method is to calculate the required capital for each type of regulatory given the RWA of the bank and check that the actual level of the regulatory capital is larger than this requirement.
If a bank is not complying for one of the 4 requirements, the regulator will put in place some restrictions on the lending activities to curb the growth of the assets and reallocate the assets towards assets with a lower risk weight to overall decrease RWA so that the ratio is boosted. [Indeed mathematically for a given numerator, decreasing the denominator increases the ratio]
Let’s consider three banks: Bank A, Bank B and Bank C. The data extracted from their balance sheets, expressed in millions, are the following.
| Bank A | Bank B | Bank C | |
| CET1 capital | 5 | 3.5 | 9.5 |
| Tier 1 capital | 6 | 4 | 10 |
| Total capital | 7 | 6 | 11 |
| Total assets | 100 | 120 | 130 |
| Risk weighted assets | 80 | 70 | 100 |
Let’s calculate the actual capital ratios and the actual leverage ratio and compare them to the requirements.
| Bank A | Bank B | Bank C | |
| CET1 capital ratio | 5/80 = 6.25% > 4.5% OK | 3.5/70 = 5% > 4.5% OK | 9.5/100 = 9.5% > 4.5% OK |
| Tier 1 capital ratio | 6/80 = 7.5% > 6% OK | 4/70 = 5.7% < 6% breach | 10/100 = 10% > 6% OK |
| Total capital ratio | 7/80 = 8.75% > 8% OK | 6/70 = 8.5% > 8% OK | 11/100 = 11% > 8% OK |
| Leverage ratio | 6/100 = 6% > 3.5% OK | 4/120 = 3.3% < 3.5% breach | 10/130 = 7.7% > 3.5% OK |
| Compliance with minimum requirements | Compliant | Not compliant | Compliant |
Bank A and C fully comply with Basel III minimum requirements. Bank B is not compliant as it breaches two requirements: the Tier 1 capital ratio and the leverage ratio are lower than the minimum ratios.
Another way to check is to calculate the required capital and compare the existing amount of capital to the requirement, as demonstrated below.
| Bank A | Bank B | Bank C | |
| CET1 capital | 5 > 80 x 4.5% =3.6 OK | 3.5 > 70 x 4.5% = 3.15 OK | 9.5 > 100 x 4.5% = 4.5 OK |
| Tier 1 capital | 6 > 80 x 6% = 4.8 OK | 4 < 70 x 6% = 4.2 breach | 10 > 100 x 6% = 6 OK |
| Total capital | 7 > 80 x 8% =6.4 OK | 6 > 70 x 8% = 5.6 OK | 11 > 100 x 8% = 8 OK |
| Leverage | 6 > 100 x 3.5% = 3.5 OK | 4 < 120 x 3.5% = 4.2 breach | 10 > 130 x 3.5% = 4.55 OK |
| Compliance with minimum requirements | Compliant | Not Compliant | Compliant |
Reassuringly and not surprisingly, we reach the same conclusions as with the ratio method. Bank A and Bank C are compliant while Bank B is not.
Bank B has not enough Tier 1 capital and/or has too many assets and/or too risky ones. In order to comply Bank B would need to issue new shares and/or retain more profit and/or issue new capital notes (to boost its Tier 1 capital) and/or sell some securities in the secondary market and/or securitise loans and/or make fewer new loans than the ones maturing (to decrease its RWA). All of these measures take time to arrange and it is likely that Bank B will be non compliant for a while. The punishment imposed by the regulator in this instance is to impose some limitations to asset growth. This punishment will naturally boost the ratio over time, contributing to finding a solution to the issue.
2.4 The increase in minimum ratios
All Basel agreements have had minimum requirements on regulatory capital based on RWA. However, Basel III has significantly increased these minima for CET1 and Tier 1 while not increasing the total capital requirement. Basel III has therefore imposed an improvement of the composition of regulatory capital in favour of better quality capital.
| Minimum requirements | Basel III | Basel I / Basel II |
| CET1 capital RWA minimum ratio | 4.5% | 2% |
| Tier 1 capital RWA minimum ratio | 6% | 4% |
| Total capital RWA minimum ratio | 8% | 8% |
| Tier 1 Leverage ratio | 3.5% | NA |
2.5 Other pillars in Basel III
The minimum requirements described in the three subsections above are part of the First Pillar. There are two other Pillars to complete Basel III capital adequacy framework.
The Second Pillar is Supervisory Review Process; this is a requirement for banks to provide regularly information about their balance sheet and their methods of measurement of certain variables to the national regulator that monitors them. During this monitoring, the regulator may detect an issue that could not be captured in the risk weight such as a too large exposure to a certain sector; to account for the increased risk, the regulator could impose a larger requirement for a particular bank, while keeping that arrangement private, to avoid creating a panic of creditors, in particular depositors.
The Third Pillar is Market Discipline by which banks are required to disclose to the public this time some data about their regulatory ratios as well as their measure of credit risk. The rationale is to provide the opportunity for the market to punish the banks that are not managing their risks properly and to award those who do a better job. That takes the form of becoming shareholders or creditors of these good banks and not invest in financial instruments issued by the less good banks.
3 Measurement of regulatory capital and risk weighted assets
3.1 Measurement of regulatory capital
As mentioned previously three different definitions of regulatory capital are used in Basel regulation: CET1 capital, Tier 1 capital and Total capital. CET1 is included in Tier 1, and Tier 1 is included in Total capital. Therefore each next definition embeds the previous one and adds some new components. Each component can be classified in mutually exclusive categories: CET1 capital, Addition Tier 1 and Tier 2. Tier 1 capital is composed of CET1 capital and Additional Tier 1. Total Capital is composed of Tier 1 capital and Tier 2 capital. The diagram below helps understanding how these definitions relate to each other.
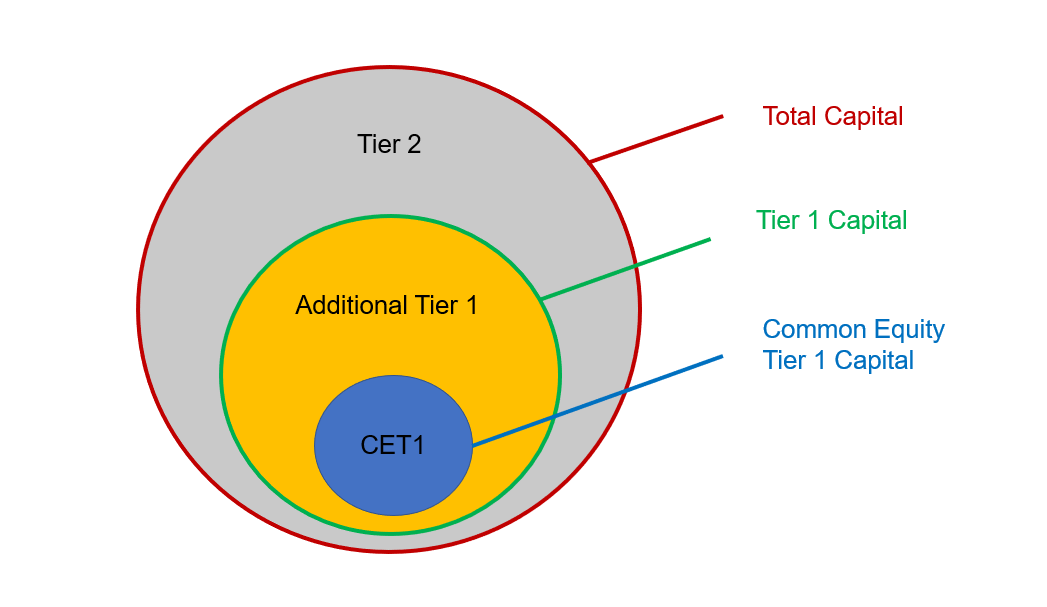
Common Equity Tier 1 (CET1) capital is composed of ordinary shares on issue, past accumulated retained earnings, current year earnings, reserves from reevaluation of securities and foreign conversion reserves. This definition is the closest to accounting equity, i.e. shareholders’ equity in the balance sheet; however, it is narrower than shareholders’ equity in the sense that preference shares are not included. CET1 capital is considered the highest quality capital as it is where the assets loss is recorded and absorbed. Ordinary shares on issue cannot absorb a loss in assets directly but it does not need to pay dividends which allow bank to boost retained earnings and also can keep shareholders’ equity positive and the bank solvent while the accumulated profits become negative. [See example in section 1.1]
The composition of CET1 capital is the only regulatory capital category for which components are explicitly described in the Australian Prudential Standard APS 111. The other regulatory capital definitions do not refer to instruments but to characteristics that these instruments must display in order to be counted in that category. The list we present below is therefore only an illustration.
Additional Tier 1 capital is composed of perpetual non cumulative preference shares, and capital notes that are convertible into ordinary shares. These components cannot absorb the shock on assets directly but can boost current earnings by not paying distributions or, in the case of capital notes, converting into ordinary shares. This category includes some debt like capital notes that would not be included in shareholders’ equity.
Tier 2 capital is composed of perpetual cumulative preference shares, life limited redeemable preference shares and term subordinated debt. These preference shares are not as good as the ones in Additional Tier 1 capital because the missed dividends have to be repaid later (so offsetting the positive effect on retained earnings) and the bank has the obligation to repay the par value of those that are redeemable. The inclusion of some sort of debt in this category makes it very distinct from shareholders’ equity.
None of these regulatory capital definitions match exactly the definition of equity in an accounting sense. CET1 is narrower than equity as it excludes preference shares that belong to accounting equity. Total Capital is wider than equity as it embeds some debt as well such as capital notes, which are definitely not equity. As far as CET1 is concerned it is narrower by not including certain types of preference shares but wider by including some form of debt.[2].
3.2 Measurement of the RWA in the standardised approach to credit risk
We describe first Basel I even though it is not in operation anymore, having been replaced in Australia by Basel II and later by Basel III. Basel II and Basel III have both the same approach in terms of risk weights, which is a direct response to a weakness of Basel I. A presentation of the old Basel I first allows to better appreciate the contributions of Basel II and III.
3.2.1 The risk weights in Basel I
Before the Basel Accord (1988) countries that implemented some form of capital regulation, such as the US, the UK or Australia, had a requirement expressed as a % of total assets, equivalent to applying a credit risk weight of 1 to all types of assets. This resulted in treating similarly risk-free central bank money and risky loans in the assets of the bank. Basel I represented a significant innovation with the introduction of different risk weights dependent on the types of the assets. Basel I used rough ad-hoc classes: Money and lending to OECD governments had the weight of 0%. Interbank lending and lending to non-OECD governments or local governments had the weight of 20%. Mortgage loans had the weight of 50% [3] and finally lending to businesses had a weight of 100%.
Although representing a neat improvement over the pre-Basel arrangements, it became clear that the system was not discriminating enough. Indeed in each category we could have a very low credit risk and very high credit risk assets treated the same way. For instance CCC-rated Argentina or Sri-Lanka would get the same risk weight of 20% than AA-rated Queensland state government. A defaulting government loans provided that it was issued by an OECD country would have a weight of 0% like central bank money. A subprime mortgage loan would have a 50% risk weight like any prime mortgage loans. Finally even very solid AAA rated companies, such as Microsoft or Apple, would have had their debt associated with a risk weight of 100%. More worryingly the system did not respect a ranking, where the lowest in one category would have a better rating than the highest in the next category. For instance lending to AAA-rated Microsoft would require 100% risk weight while lending to CCC rated Venezuela would be only 20%. All these examples illustrate the lack of risk sensitiveness of Basel I weights, i.e. the disconnection of the weight and the actual probability of defaulting, and their arbitrary nature.
As illustrated below, two banks hold very different quality of assets. Good Bank holds much safer assets than Not-so-Good Bank (based on credit rating agencies assessment). However, under Basel I they were required to hold the same amount of regulatory capital because they were holding the same value across all categories and would apply the same risk weight to that value, irrespective of the different ratings.
| Good Bank | Not-so-Good Bank | Value of assets | Risk weight in Basel I |
| Lending to Australia AAA | Lending to Costa Rica B | 45 | 0% |
| Lending to China A+ | Lending to Belarus CCC- | 20 | 20% |
| Mortgage Prime loans | Mortgage Subprime Loans | 10 | 50% |
| Lending to Microsoft AAA | Lending to Netflix BB | 25 | 100% |
Good Bank and Not-So-Good Bank have indeed the same risk weighted assets:

They therefore would require the same value of regulatory capital even though Not-So-Good Bank’s assets are much more likely to default than Good Bank’s assets. Basel I system does not discriminate well between low and high risk. As a way to check their understanding, the reader could create an example where a better bank actually has a higher RWA for the same total assets as a poorer bank.
3.2.2 The risk weights in Basel II and III
Basel II (2004) and Basel III (2010) have drastically changed that system to ensure that the risk weights better reflect the actual credit risk. Rather than assigning a risk weight simply on the basis of the nature of the assets (whose type the issuer is), Basel II and Basel III also consider the credit rating of the assets assigned by external credit rating agencies. Credit rating agencies are paid by issuers of securities to assess the credit risk at the issue of the debt instruments and also to adjust these ratings during the life of the instruments. They are also providing a credit rating of the issuer overall not considering a particular issue of securities but the general credit profile of the company or the state. Loans as instruments are not rated by credit rating agencies, as they are not securities, but the borrower, if it is large enough to issue securities, is likely to have a rating that can be extrapolated to the loans. A borrower of the loan that is small , such as an individual or a small and medium enterprise, does not have a credit rating from the agencies and belong to the category unrated.
Let’s go back to the case of assets that were issued with a rating or by an issuer that has a rating. The risk weight is assigned through a two-step process. Firstly the rating of the different agencies (AAA, BB, C etc.) are converted into a grade (1, 2, 3 etc) thanks to a table of conversion in Attachment E of the Australian Prudential Standard APS 112, regardless of the nature of the assets. Secondly, depending on the nature of the assets (which class of claim it is), the grade is assigned a risk weight. The details of these weights by class are given in Attachment A of the Australian Prudential Standard APS 112.
Take a loan or a bond issued by an Australian company. This case belongs to Class VII item 15. If the borrower is a small company without rating the risk weight is 100%. If the grade is 1 (very good quality) the weight is 20%. However, if the grade is 6 (very poor) the weight is 150%. Instead of applying the same risk weight of 100% to all claims on companies as in Basel I, Basel II and III allow a wide range of weights (20% to 150%), thereby providing more discrimination. The same can be said for government debts, Class II item 6. The distinction OECD or not is not relevant any more but the grade is: grade 1 gets a weight of 0% while a grade 6 gives a weight of 150%. The range of [0% ;150%] replaces the two values 0% (OECD) and 20% (non OECD) in Basel I. Note that the Australian government Class II item 5 has the weight 0%, even if it were to lose its current AAA rating.
Residential mortgage loans are classified by loan to valuation, presence of insurance and whether they are standard or non standard (standard meaning that the capacity to repay the loan has been checked and documented, the property valued and marketable).
Given that every class of assets can be assigned a value within a range of weights instead of only one single value, Basel II and Basel III requirements are more credit risk-sensitive than Basel I.
Using the same example as in 3.2.1, we illustrate how Basel II and III are better at embedded the true credit profile of the bank’s assets. Assume the ratings are from Standard and Poor.
| Good Bank | Not-so-Good Bank | Value of assets | Risk weight in Basel II/III for Good Bank | Risk weight in Basel II/III for Not-so-Good Bank |
| Lending to Australian government AAA | Lending to Costa Rican government B | 45 | 0% (grade 1 in Class II item 5) | 100% (grade 5 in Class II item 6) |
| Lending to Chinese government A+ | Lending to Belarus CCC- | 20 | 20% (grade 2 in Class II item 6) | 150% (grade 6 in Class II item 6) |
| Residential Mortgage Prime loans (standard LVR 45% no insurance) | Residential Mortgage Subprime Loans (non standard LVR 85% no insurance) | 10 | 35% (unrated Class IV standard) | 100% (unrated Class IV non standard) |
| Lending to Microsoft AAA | Lending to Netflix BB | 25 | 20% (grade 1 in Class VII item 15) | 100% (grade 4 in Class VII item 15) |
Good Bank has the following risk weighted assets:

Not-So-Good Bank has the following risk weighted assets:

While they had the same requirements in Basel I now they have a very different profile and Good Bank has nearly 10 times less need of capital than its competitor.
3.3 Measurement of the RWA in the internal rating based approach to credit risk
Large banks can opt to an alternative option to the standardised approach, the internal rating based (IRB) approach. Banks can use their home credit-risk models to estimate the risk of their borrowers. They must estimate risk components such as probability of default, loss given default, exposure at default, and effective maturity. Then a risk-weight function (imposed by the regulator) converts these inputs into a risk weight.
The regulator assesses and approves bank credit risk models. Therefore it is not a legitimate criticism to claim that the IRB approach lets banks freely choose the weight they want! In Australia banks interested in IRB approach had to submit their credit risk models to APRA within a certain window so the regulator could compare them, identify the best practice that could be then recommended to all banks. It is true, nevertheless, that the function has been voluntarily calibrated so that the weight output is lower than the weight that the standardised approach would generate. This is intentional and a mechanism to incentivise more banks to choose the IRB approach and encourage the adoption of more sophisticated credit risk management practices.
However, during the GFC, it was noticed that the banks using IRB approach had not enough capital to withstand the write off of their loans and the decrease in the marketable value of their trading and available-for-sale securities. This is the reason why a leverage ratio requirement was introduced: it is calculated on total assets and therefore is not affected by the way risk weights are calculated. This is the reason also why capital floors were introduced. The RWA used in IRB approach cannot be below 72.5% of the RWA calculated with the standardised approach. If it was below, we would use 72.5% RWA of standardised approach instead to calculate the ratio and/or the required capital.
4. Conservation and countercyclical capital buffers
Basel III framework introduced capital buffer requirements to be met as an extra cushion on top of the minimum requirements described in Section 2. Buffers need to be made exclusively of CET1 capital and after the minimum requirements have been fulfilled. A warning about terminology is necessary here, as it is a common source of confusion: even though a buffer requirement is expressed as a threshold that needs to be exceeded (so a minimum really), the Basel III framework does NOT characterize buffers as being part of the minimum requirements. ‘Minimum requirements’ in Basel III exclude buffers, which constitute a separate requirement.
Buffers are a novelty of Basel III to address an issue that became apparent during the global financial crisis, the inherent procyclical nature of capital minimum requirements. The minimum capital requirements were blamed for having contributed to the amplification of the recession during the GFC, by preventing banks to lend to businesses and households when they needed it the most. The buffers have been designed to mitigate the procyclical effect.
4.1 Why we need buffers: the procyclical nature of the minimum ratios
The ratios described in 2.1 are not meant to be breached and if they are, strict limitations on assets apply as a punishment. Because they cannot be breached the decrease in the ratios due to the write off needs to be addressed so that the ratio can increase back to the minimum level or above as soon as possible.
The minimum ratios are pro-cyclical by nature as they incentivise banks to cut funding to companies in period of recession making the economic situation direr and boost the funding to companies in period of boom making the economy even stronger. The regulation accentuates the business cycle. Here are the mechanisms at play.
In a period of economic bust, when a bank loses assets and an equivalent amount of equity due to write off or market depreciation, the capital ratios necessarily decrease. This is because removing the same amount at the denominator (assuming a risk weight of 100%) and at the numerator when the initial ratio is less than 1 necessarily leads to a decrease in the ratio. Let’s check that this is the case. Assume Bank A from Section 2.3 above loses 2 million of assets, risk weighted at 100%; this results in a decrease by 2 million in both the regulatory capital at the numerator and in the RWA at the denominator. We can see in the table below that all 4 capital ratios have decreased as a result, breaching now 3 requirements out of 4. We then redo the exercise if the weight is 150%; this results in a decrease by 2 million in the numerator and a decrease by 3 million in the denominator. Again, all ratios decrease, even though by less. Again 3 requirements out of 4 are no longer met.
Let’s calculate the various actual capital ratios and the actual leverage ratio and compare them before and after the reduction in assets.
| Bank A (before shock on assets) | Bank A (after shock on assets with weight risk 100%) | Bank A (after shock on assets with weight risk 150%) | |
| CET1 capital ratio | 5/80 = 6.25% > 4.5% OK | (5-2)/(80-2) = 3/78 =3.8% < 4.5% breach | (5-2)/(80-3) = 3/77 =3.91% < 4.5% breach |
| Tier 1 capital ratio | 6/80 = 7.5% > 6% OK | (6-2)/(80-2) = 4 /78 =5.13% < 6% breach | (6-2)/(80-3) = 4/77 =5.19% < 6% breach |
| Total capital ratio | 7/80 = 8.75% > 8% OK | (7-2)/(80-2) = 5/78= 6.4% < 8% breach | (7-2)/(80-3) = 5/77= 6.5% < 8% breach |
| Leverage ratio | 6/100 = 6% > 3.5% OK | (6-2)/(100 -2) = 4/98=4.08% > 3.5% OK | (6-2)/(100 -2) = 4/98=4.08% > 3.5% OK |
| Compliance with minimum requirements | Compliant | Not Compliant | Not Compliant |
Bank A needs to raise the ratios back to level compatible with the minimum requirements. In periods of losses of this magnitude, it is very difficult for a bank to issue new shares or to generate enough earnings to boost its accumulated retained profits. It is therefore hard to increase the numerator of the ratio. Its only reasonable option is to decrease RWA by decreasing its assets and/or reallocating its assets to classes that are assigned lower risk weight. For instance Bank A can sell the securities with a positive weight and get more central bank money with 0% weight and/or buys fewer newly issued securities than the maturing ones so the stock decreases; it can securitise loans to remove them from their balance sheet [see chapter 5] or make fewer new loans than the maturing ones so that the stock of loans decreases in net.
In a period of economic bust the minimum requirements force banks to decrease/limit the funding they give to the economy, and/or contribute to asset prices collapse, making the economic crisis worse.
In periods of economic booms, banks make large profits, which boost their equity in the numerator of the capital ratio, increasing the ratio. Banks regulatory capital can support more assets, improving the funding of companies and households and therefore making the economy stronger.
The introduction of buffers – the conservation buffer and the countercyclical buffer – in Basel III intended to break that dynamics. In period of crisis they give banks the opportunity to lose capital, let their capital ratio decrease, breach the buffer requirements, and not feel compelled to limit their assets. In period of economic boom banks can easily rebuild their ratios to meet the buffer requirements. They work by making the penalty to breach them not that serious and not damaging to the funding of the economy.
4.2 The buffers
4.2.1 The conservation buffer
All ADIs are submitted to a conservation buffer of either 2.5% CET1 for banks using the standardised approach when calculating the risk weight of their assets or 3.75% CET1 for banks using the IRB approach. The higher requirement for IRB banks is recent and will apply from January 2023.
The conservation buffers apply at the same level and across all countries that have adopted Basel III reforms, regardless of their financial cycle. All countries have the same fixed requirements that regulators cannot use as a tool since the value is fixed at 2.5% (or 3.75% for IRB approach).
Breaching the requirement induces a ‘soft’ punishment consisting in limited distribution of bonuses and dividends. Unlike the punishment relating to the breach of the minimum requirements described in Section 2.3, this one has no effect on assets and therefore no immediate effect on the funding of businesses and households: pro-cyclicality is not happening. The constraint on distribution of bonuses and dividends strengthens equity and regulatory capital, therefore automatically contribute to slowly increase the capital ratio by increasing the numerator of the ratio. There is no requirement to decrease the RWA at the denominator as is the case for a breach in the minimum requirement.
4.2.2 Extra buffer for Domestic Systemically Important Banks and Global Systemically Important Banks
Banks that meet the criteria of Domestic systemically important banks (D-SIB) are asked to provide a 1% extension to the conservation buffer. To be considered as D-SIB, a bank needs to rank high with respect to 4 criteria: size, interconnectedness, lack of substitutes, and complexity. As of June 2022 only the four largest banks in Australia are recognized by APRA as D-SIB: ANZ, NAB, CBA and Westpac. Macquarie Bank is meeting the complexity criteria but not the three others. These criteria and list of D-SIB was established in 2013 and published in an APRA Information Paper. This list has not been altered since that date.
The reason why D-SIB are asked to hold more regulatory buffer is not because they have a higher probability of failure than the other banks but because if they were to fail the domestic impact of failure on the financial system would be more significant. By imposing higher capital buffer requirement the objective is to decrease the probability of failure so that the financial system stability is less at risk.
Be aware that D-SIB are also using the IRB approach for the calculation of their risk weights; this results in an overall extra buffer of 2.25% (1.25% + 1 %) compared to non D-SIB using the standardised approach.
Basel III framework also requires further buffer for Global systemically important banks (G -SIB). None of the Australian banks, however, has enough presence overseas or interconnectedness to overseas banks to be in this category. As of November 2021 (the list is updated every year in November by the Basel Committee for Bank Supervision), there are 30 G-SIB in the world among which JP Morgan Chase, required to hold an extra 2.5% buffer, and BNP Paribas, Citigroup and HSBC, imposed to hold an extra 2% buffer.
4.2.3 The countercyclical buffer
Basel III framework stipulates that countries must choose a countercyclical buffer (sometimes contracted as Ccyb in regulatory documents) in the range of [0%-2.5%], depending on their current needs related to their financial cycle.
The regulator increases the CCyB when the risk of future write off and drops in market value increases so that banks, not yet affected, can easily boost their cushion to prepare for decrease in assets before the risk materialises; banks are usually given 1 year to reach the new level so for the following 12 months the requirement will not change; later, when the risk materialises and banks start losing equity, the regulator decreases the requirement. That has immediate effect. When the risk has receded and/or has already materialised, the countercyclical buffer can go back to its neutral value, which may be different for each country. In Australia the neutral level will be 1% from 2023, while Sweden has a 2% neutral level.
Decreasing the CCyB when banks lose equity results in a lower chance to breach the requirement. To go back to the analogy of household savings it would mean that the level of saving can go back as the household needs it.
Before January 2023, the neutral/default level of the countercyclical buffer (CCyB) has been 0% and was never raised as APRA assessed that banks never needed this supplementary cushion. However, from January 2023 Australia joined the group of countries such as the UK that set their neutral level at a positive level. In Australia from January 2023 this neutral positive level will be 1%. That allows the regulator to decrease the buffer, which is useful if they had not anticipated the issue and had no time to increase the buffer first. When it is 0% by default, the regulator cannot decrease it. From that perspective, the regulator has more flexibility with a positive default value of the CCyB.
4.3 Checking compliance and Punishment
The system of punishment when breaching buffers is not as harsh as for the minimum requirements. The punishment is on the distribution of bonuses and dividends, therefore not affecting the funding of the economy. The whole idea is to possibly use that cushion letting the capital ratio drop.
4.3.1 Easy way to check compliance
The easiest way to check compliance is to check minimum requirements and buffers at the same time. Assume for instance that the CCyB is at 1% (its default level) and that the bank under review is a domestic bank of average size using the standardised approach to calculate its risk weights.
Even though buffers need absolutely to be in CET1 capital, we can check that a bank complies by checking that the requirements are met for all types of capital. The buffers are 2.5% + 1% =3.5% for that profile of bank. The requirements are therefore:


One may be wrongly tempted to only add the buffer requirement to the CET1 capital ratio, on the ground that the buffer needs to be in CET1 capital. However, doing so could be misleading as it could be that the CET1 capital available to cover the buffer in the first equation be actually required to cover the minimum requirement for Tier1 capital due to insufficient Additional Tier1 capital. In that case we cannot be sure that the CET1 capital we put aside for the buffer was actually available for the buffer. If it was needed for any of the minima then it would not be available for the buffer.
One can show that if we check all the conditions while including the buffers in the requirement in all of them we then can be entirely sure that there will be enough CET1 free for the buffers, after having met all the minimum requirements.
Bank A, which was compliant with the minimum requirements, is unfortunately not meeting any of the requirements when we add the two buffers. Bank B does not comply. Bank C does comply to all but one ratio so overall does not comply.
| Bank A | Bank B | Bank C | |
| CET1 capital ratio | 5/80 = 6.25% < 8% breach | 3.5/70 = 5% < 8% breach | 9.5/100 = 9.5% > 8% OK |
| Tier 1 capital ratio | 6/80 = 7.5% < 9.5% breach | 4/70 = 5.7% < 9.5% breach | 10/100 = 10% > 9.5% OK |
| Total capital ratio | 7/80 = 8.75% < 11.5% breach | 6/70 = 8.5% < 11.5% breach | 11/100 = 11% < 11.5% breach |
In the case where all these ratios meet the requirements this method is the fastest. However, if the bank does not meet the criteria, trying to find a solution requires more sophisticated analysis. Which type of capital could be added at the lowest cost to meet the minimum and the buffers?
4.3.2 Measure of free CET1 after meeting the minimum requirements
Let’s take another approach that will be helpful to identify the issue and will give the best solution to meet the requirements.
How much CET1 is needed just to meet the minimum requirements. Let’s focus on Bank C. Here is the details of all the components of the capital.
| Bank C | |
| CET1 capital | 9.5 |
| Additional Tier 1 capital | 0.5 |
| Tier 2 capital | 1 |
| Total assets | 130 |
| Risk weighted assets | 100 |
To meet CET1 minimum requirement 4.5 CET1 is required.
The same CET1 can be re-used to meet Tier 1 minimum requirement. Another 1.5 of Tier 1 is needed. Ideally we would like to use in priority Additional tier1 so we save CET1. However, we are short of 1 Additional Tier 1 and that needs to be filled with more CET1.
The same CET1 and Additional Tier1 can be used to meet Total Capital. Another 2 of Total capital is needed. Ideally we would like to use in priority Tier 2 to save CET1. But we are short of 1 Tier 2 and that needs to be filled with more CET1.
In total 4.5 +1 +1 =6.5 CET1 capital is going to be committed to the minimum requirements. We have 9.5 CET1 in total so 3 CET1 capital is free and available for the conservation and countercyclical buffers. We are short of 0.5 CET1 for meeting the buffers requirements of an average size bank using the standard approach to calculate its risk weighted assets.
What is the best solution? Adding 0.5 CET1 is the straightforward solution but the most costly; alternatively, if we wanted to get easier capital the bank could get 0.5 of Tier 2 capital, which would free 0.5 CET1 for the buffer.
5. Conclusion
The first Basel agreement was a milestone in the history of bank capital regulation, by introducing regulatory capital requirements that were sensitive to credit risk. Rapidly the regulation extended to other risks, such as market and operational risks, that we have not covered in this chapter. Basel II will be remembered for introducing a new way of calculating the credit risk weights, based on sophisticated risk modelling, which constituted an incentive for banks to improve risk measurements. It will also be remembered as being a weakness during the global financial crisis, not equipping banks with enough capital to sustain large write downs of their assets. Basel III and its new 2023 version were a milestone in significantly increasing the capital requirements of banks, through buffers that oblige banks to get more regulatory capital and also provide a solution to the inherent pro-cyclicality of minimum requirements. The largest banks in Australia that use IRB approach have seen their capital requirements for CET1 increase from 2% in Basel I to 10.25% from 2023 onwards! That constitutes a very significant improvement over the years of the resilience of the banking system. Basel IV, the colloquial name for the 2023 reform of Basel III, is likely to be a hot topic in bank job interviews, so be prepared!
