
5 Valuing Debt
5.1 Introduction
At the end of this chapter, you will be able to:
- explain the difference between debt and equity
- identify different types of bonds and their features
- distinguish between a bond’s coupon rate and yield to maturity, and use these to calculate the value of a bond
- explain the relationship between bond prices, interest rates, and default risk.

Debt has been a feature of human society for thousands of years. In Book 1 of Plato’s Republic, Socrates discusses the issue of debt with Cephalus, a wealthy businessman, and Polemarchus, a fellow Athenian philosopher. Cephalus claims that justice may be defined as speaking the truth and repaying one’s debts. As a counter-argument, Socrates presents the following case:
“Suppose that a friend when in his right mind has deposited arms with me and he asks for them when he is not in his right mind, ought I to give them back to him?”
In reply, Polemarchus points out that repaying debt can be interpreted as giving each what they are owed, and that what one owes a friend is quite distinct from what they owe an enemy.
Putting ethical considerations aside, in today’s lesson we will try to put a more concrete value on debt using the time value of money concept we learned in the previous chapter.
5.2 Debt vs Equity
From a company perspective, financing a new investment or to maintain its current operations can come from either internal or external resources. If a company has residual cash available, it might use this to fund their investment internally. Alternatively, a company could raise the capital needed from investors by issuing debt or equity.
From an investor perspective, he/she can purchase debt or equity in a company. When an investor does this, he/she is purchasing a bundle of rights. For equity, these rights include a claim to the company's residual cash flows and the ability to vote for the board of directors. Equity is also known as “shares”, and the price you pay for those shares is the amount you believe best represents the current value of the share, which is a function of the future cash flows you will receive from holding those shares. We will discuss equity in detail in the next chapter (Chapter 6).
In this chapter, we will focus on debt.
When you purchase debt, the rights you receive include the right to a specified series of future cash flows, plus other rights that might be negotiated. For example, for convertible bonds, bondholders have the right to convert debt into equity. Issuing debt is a way to borrow money. A company can seek a loan from a bank or sell bonds to investors. In either case, the company will have to compensate the holders of their debt by paying interest. The essential difference between debt and equity is that the interest payments to lenders (debt) are generally fixed upfront and compulsory, while the payments to shareholders are only a residual, and are paid entirely at the discretion of the company.
The differences between debt and equity are summarised in the table below:
| Debt | Equity |
|---|---|
| Rights include the right to a specified series of future cash flows, plus other rights that might be negotiated. For example, for convertible bonds, bondholders have the right to convert debt into equity. | Rights include a claim to the company's residual cash flows and the ability to vote for the board of directors |
| Issuing debt is a way to borrow money. A company can seek a loan from a bank or sell bonds to investors. In either case, the company will have to compensate the holders of their debt by paying interest. | Also known as “shares”, and the price you pay for those shares is the amount you believe best represents the current value of the share, which is a function of the future cash flows you will receive from holding those shares. |
| The interest payments to lenders (debt) are generally fixed upfront and compulsory | Payments to shareholders are only a residual, and are paid entirely at the discretion of the company |
| In this chapter, we will focus on debt. | We will discuss equity in detail in the Chapter 6 |
Additionally, debt holders have first priority in receiving payments:
1. Interest payment to Debt holders needs to be settled first before dividend can be paid to Equity holders are never, and
2. If the company goes bankrupt the debt holders have a first claim on the company’s cash flows and assets. In other words, they have a senior position with regards to claims on the company's residual cash flows from liquidation. Equity holders, by contrast, have an unlimited upside potential but do face the possibility of losing the entire value of their investment if the company goes bankrupt.
5.3 Bond Types and Features
A bond is a type of negotiable debt instrument which sets forth an agreement between two parties: an issuer and a holder. Companies and governments can issue debt securities to raise capital from investors who will hold the debt. Bonds are generally used for the purpose of long-term borrowing (i.e., greater than one year).
Some key terms relating to bonds are summarised in the table below:
| Principal amount or Face Value or par value | The payment |
| Maturity Date of the Bond | Date at which the payment is made |
| Coupons |
|
| Trust Deed | The principal and the coupon, and the magnitude and timing, are set at the time the bond is issued in this contract |
The issuer of the bond agrees to deliver an agreed-upon payment to the holder at an agreed-upon date. The payment is referred to as the principal amount, face value, or par value. The date at which the payment is made is called the maturity date of the bond. Additionally, the issuer may decide to make periodic payments, which are a fixed percentage of the principal amount (i.e. interest payments). These payments are known as coupons and are made at fixed intervals (typically every 6 months). Accordingly, the amount of the coupon payments is determined by the coupon rate and fixed when the bond is issued. It is important to note that both the principal and the coupon, and the magnitude and timing, are set at the time the bond is issued in a contract called the Trust Deed. Thus, the coupon payment does not change throughout the life of the bond. The holder can pass along ownership of the bond (e.g. sell the bond) to another party who will then hold the rights initially granted to the original holder.
We next introduce different types of bonds commonly issued.
5.3.1 Zero-Coupon Bonds
Bond issuers need not necessarily offer coupon payments. Instead, they can issue zero-coupon bonds. In this case, the only cash flow that the holder of the bond receives is the face value at the maturity date. Of course, the price at which a zero-coupon bond sells is much lower than the face value, given investors want to be compensated for taking on the risk of the investment. This is easy to understand as the price of the bond would be equal to the present value of its expected cash flow. As you might imagine then, the discount rate used in this present value calculation will play a large part in determining the price.
5.3.2 Coupon Bonds
As with zero-coupon bonds, the issuer of a coupon bond agrees to repay the face value of the debt at maturity. In addition, they agree to make periodic coupon payments.
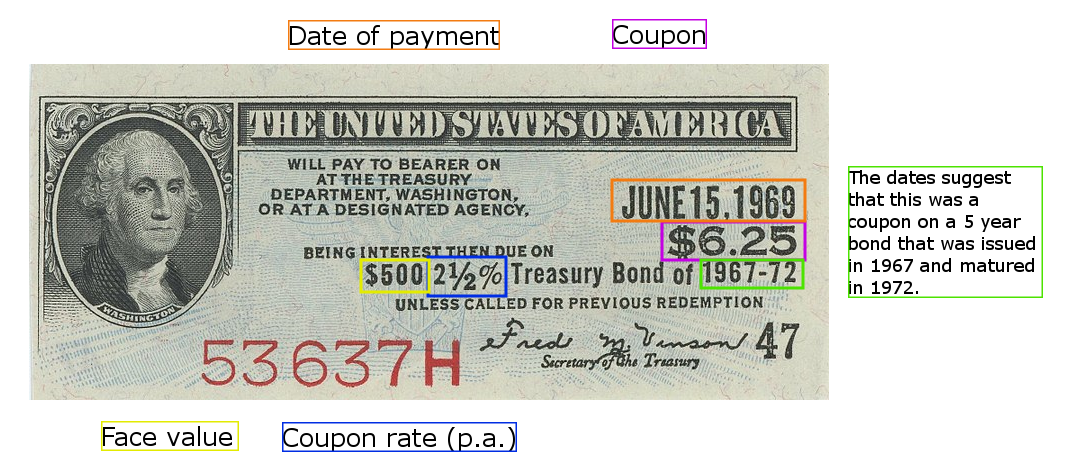
Below is a coupon from a U.S. treasury bond that paid interest (coupon) payments twice per year. Why is the coupon worth $6.25?
Here is a video introducing the concept of bonds, focusing on coupon bonds which are the most common type of bond. It will help you answer the question above.
5.3.3 Convertible Bonds
Sometimes companies will issue securities that take on both the features of bonds we have described above and those of equity shares. These convertible bonds allow the holder to convert the value of the bond into shares of the issuing company at a predetermined ratio.
In this way, the holder of the convertible bond is able to take advantage of the upside if the value of the company (and thus the value of its shares) increases but also are protected against the downside by the debt covenants and collateral requirements mentioned earlier.
Because the holders of convertible bonds have this advantage over holders of ordinary bonds, the former is willing to pay a premium for their security over that paid by the latter.
5.4 Calculating Bond Value
In Chapters 3 and 4 we have learnt that we can value assets by converting the future cash flows to that asset into the same point in time (often the “present”). The value of an asset (i.e. its price), therefore, is the present value of all its future payments. In the case of a bond, it is the sum of the present value of the face amount and the present value of the coupon payments (if it's a coupon bond).
As we have seen, the present value of a cash flow is calculated by discounting the cash flow at an appropriate rate. This appropriate discount rate is in turn determined by the market (it is a function of the risk that investors associate with the expected cash flow). In the case of a bond, we have to be careful. While the issuer of the bond is offering a coupon rate to potential lenders, this is not the market-determined discount rate. The discount rate, or interest rate, on a bond required by the market is known as the bond’s yield to maturity. Unlike the coupon rate, the bond’s yield to maturity can change over the life of the bond as the market continuously evaluates the risk associated with the investment.
To calculate the value of a bond we will need both the coupon rate and the yield to maturity. The coupon rate will determine the amount of the coupon payments promised to the bondholder, and the market yield will determine the rate that we use to compute the present value of those promised payments.
[latex]PV(\text { coupons })=C \times\left[\frac{1-\left[1 /(1+r)^{n}\right]}{r}\right][/latex]
where C is the coupon payment, r is the yield to maturity expressed as a periodic interest rate1 and n is the number of periods to maturity or the number of coupon payments remaining. Note that the coupon payment is calculated using the coupon rate and the bond’s face value:
[latex]C=\frac{\text { coupon rate }}{\text { number of coupons per year }} \times \text{Face Value}[/latex]
1 Bond yields are quoted as Annual Percentage Rates (APRs) with compounding at the same frequency as the coupon payments. If the yield is quoted as 5% and there are 2 coupons per year, then the r in the present value equations will be [latex]5\% \div 2 = 2.5\%[/latex] or [latex]0.025[/latex].
Apart from receiving coupon payments, bond holders will also receive the face value of the bond on the maturity date. We need to calculate the present value of the face amount:
[latex]P V(\text { Face Value })=\frac{\text { Face Value }}{(1+r)^{n}}[/latex]
Therefore, the value of the bond should be the sum of the present value of all future coupon payments and the present value of face amount.
[latex]Bond Value =P V( coupons )+P V( Face Value )=C \times\left[\frac{1-[1 /(1+r)^{n}]}{r}\right]+\frac{\text { Face Value }}{(1+r)^{n}}[/latex]
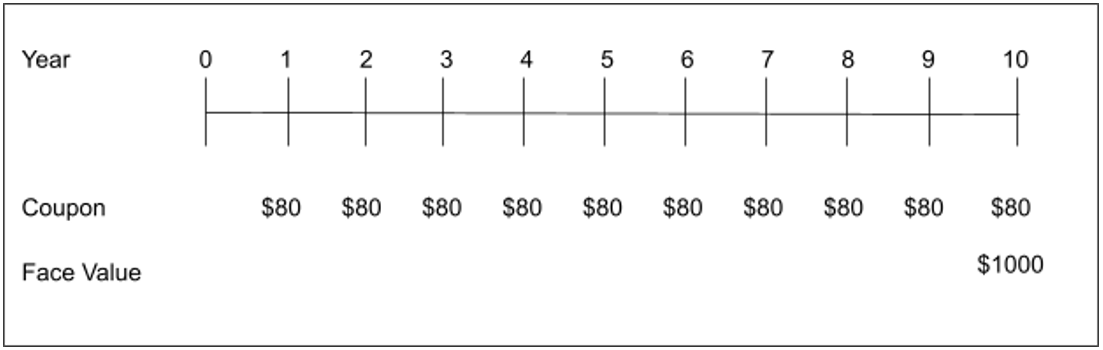
We can illustrate the cash flows of the bond using a timeline, as shown below.
The present value of the principal repayment (face value) in year 10 is:
[latex]P V_{\text{Face}}=\$ 1000 \div (1+0.08)^{10}=\$ 463.19[/latex]
The present value of the coupon payments is
[latex]P V_{\text {coupon}}=\left(\left(0.08 \times \frac {\$ 1000 }{ 1}\right) \times \left[\frac{1-\left[1 /(1.08)^{10}\right]}{0.08}\right]\right)=\$ 536.81[/latex]
The value of the bond, the price at which it will sell today, will be the sum of the above two present values:
[latex]\text {Bond Value}=\$ 463.19+\$ 536.81=\$ 1000[/latex]
In this case, the bond is selling at exactly its face value. This is sometimes referred to as selling at par or par value (where par is another word for face). The reason for this is that the market rate and the coupon rate are exactly the same - which means that an investor is receiving exactly the interest that they require every time period (as determined by the market rate) through the coupon payment.
But what happens when the coupon rate and the market rate are not the same? To illustrate, let us suppose that a year after Stark Industries’ bond is issued, interest rates have increased from 8% to 10%. What will the value of the bond be now? Again we calculate the present value of the principal repayment
[latex]P V_{\text{Face}}=\$ 1000 \div(1+0.10)^{9}=\$ 424.10[/latex]
(note that since a year has passed, there are only 9 years and 9 coupon payments remaining).
And the present value of the coupon payments
[latex]P V_{\text {coupon}}=(\$ 1000 \times 0.08) \times\left[\frac{1-\left[1 /(1+0.10)^{9}\right]}{0.10}\right]=\$ 460.72[/latex]
Then the total value of the bond is:
[latex]\text {Bond Value}=\$ 424.10+\$ 460.72=\$ 884.82[/latex]
...or approximately $885. The bond is selling at a discount to its face value. This is because the bond is offering a coupon rate which is less than the available market rate. Investors could easily get a 10% return for a similar risk investment, so why should they pay full price for an asset that offers them less than 10% in interest payments. The bond is said to be priced to yield 10% at $885.
The difference between the face value and the present value of the bond in year 1 is $115. This $115 represents a gain over the initial amount paid (i.e. $885) that the investor will receive when the bond matures. This gain is meant to compensate the investor for the below-market rate being offered by the coupon payments.
Another way to understand this discount of $115 is to compare Stark Industries bond, which now has 9 years left to maturity, to a new bond issued to sell at par that also has 9 years to maturity and has a face value of $1000. To sell at par, this bond would need to have a coupon rate of 10%. Therefore, Stark Industries’ bond would have coupon payments which are $20 less than that of the new bond. This difference in coupon payments can be valued as annuity. At a 10% discount rate, the present value of the annuity is:
[latex]P V_{\text{lost}}=(\$ 20) \times\left[\frac{1-\left[1 /\left(1.10^{9}\right]\right.}{0.10}\right]=\$ 115.18[/latex]
Not surprisingly, this is the amount below face value at which Stark Industries’ bond is selling.
To summarize we have that the value of a bond is given by
[latex]\text {Bond Value}=C \times\left[\frac{1-\left[1 /(1+r)^{n}\right]}{r}\right]+\frac{F}{(1+r)^{n}} \text { , where } C=\frac{\text { coupon rate }}{\text { number of coupons per year }} \times F[/latex]
So far we have used annual coupon payments, but often coupons are paid semi-annually (or perhaps even more frequently). If this is the case, we always assume that the required return by the investors ( r ) is an APR compounded at the frequency that the coupons are paid. For example, if coupons are paid semi-annually, we have 2 coupons per year, and thus we assume that the rate we have been given is an APR compounded semi-annually and we need to divide the APR by 2 to compute the semi-annual rate, and our n will have to be defined as the number of semi-annual coupons paid over the remaining life of the bond.
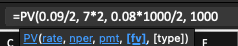
5.4.1 Calculating Bond Value - Worked Example
What is the price of a seven-year 8% coupon bond paying semi-annual coupons with a face value of $1000, if the current market yield is 9%?
VIDEO: Calculating the bond value (YouTube, 8m42s)
For the example above, you also could have used EXCEL using the PV() function:
Exercise
Q1. What if the interest rate stays the same?
If the interest rate had stayed at 8% after one year (when there are 9 years remaining), what would the value of Stark Industries’ bond have been?
Q2. What if the interest rate decreased?
What if the interest rate had decreased to 6% after one year (when there are 9 years remaining)?
Q3. How much more?
How much more? What is the price of the bond at a 6% market yield?
Test Your Knowledge
Q1. Bluechip Ltd issued a 10-year zero-coupon bond. The face value of the bond is $1,000 and yield to maturity is 5%. What was the issuance price?
Q2. Goodfield Foods has an outstanding bond that has 7 years to maturity and a coupon rate of 6%. The coupon is paid annually. The bonds have a face value of $1000. What is the bond price if the current yield to maturity is 5%?
Q3. Rio Tinto issued a 15-year bond one year ago at a coupon rate of 4.8%. The bonds have a face value of $100 and pay coupons semi-annually. If the current yield to maturity on these bonds are 5%. What is the current bond price?
5.5 Relationship Between Price, Interest Rate & Default Risk
5.5.1 Interest Rate Risk
From our previous discussion in 5.3, you might have noticed that bonds carry a certain amount of interest rate risk. That is, the value of the bond is sensitive to changes in the interest rate. That means bond carries interest rate risk.
As we will explain in this section, the degree of sensitivity to the interest rate is not the same for every bond; all else equal, the interest rate risk is greater for bonds with longer maturity dates, and for bonds with lower coupon rates. The following chart illustrates how interest rate risk increases for bonds of longer maturity.
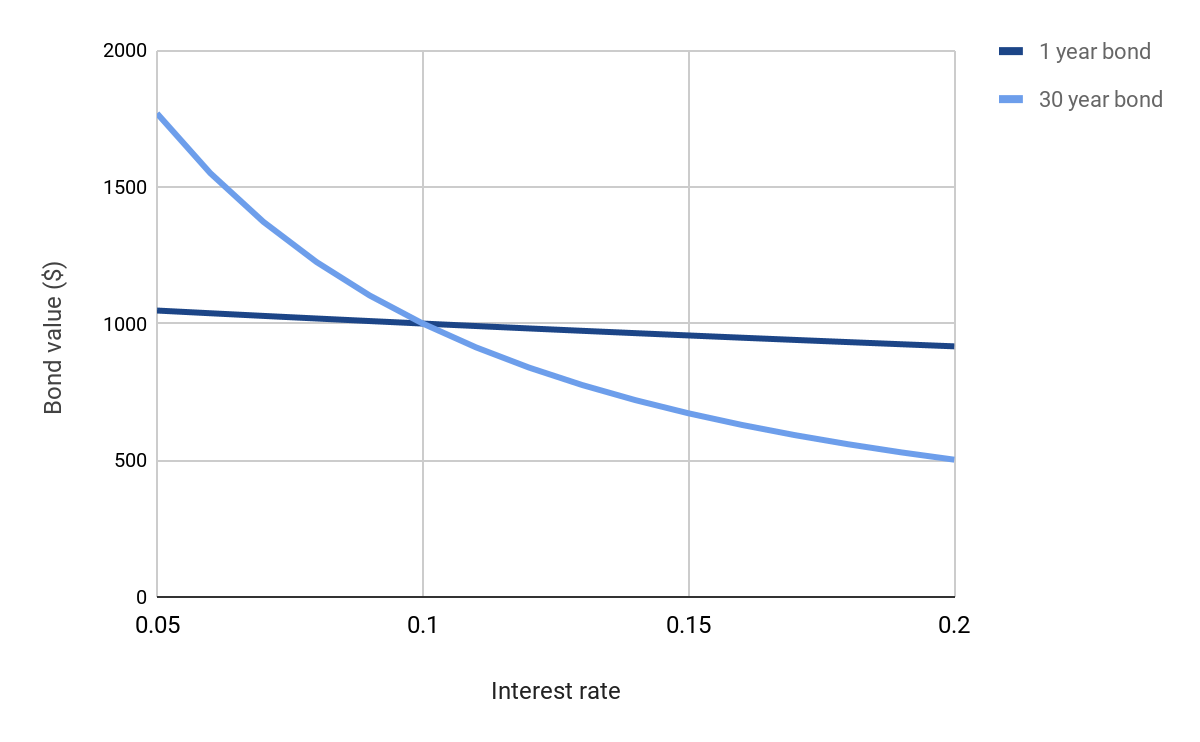
We have plotted the values of two bonds against a changing yield to maturity (interest rate). Apart from their maturity, the bonds are exactly the same (same face value and same coupon rate). As you can see the slope of the line is much steeper for the 30 year bond compared to the 1 year bond. This indicates that small changes in the interest rate will have a proportionately larger effect on the price of the longer maturity bond compared to the price of short maturity bond.
All else equal, bonds with higher coupon payments are subject to a lower interest rate risk than bonds with lower coupon payments. This is because the total value of a bond with a lower coupon rate is proportionally more dependent on the face value than that of a bond with a higher coupon rate because the lower the coupon rate, the lower the proportion of total cash flows that come from those coupon payments. Since principal repayment occurs at maturity, more of the value of the bond with the lower coupon rate is subject to discounting compared to that of the bond with the higher coupon rate.
Exercise
Q1. Bond A and Bond B both have coupon rate of 5%, paid annually. Bond A has a maturity of 5 years while the maturity of Bond B is 10 years. Assume the face value of both bonds are $100 and the current yield to maturity is 5%.
Before doing any calculation, which bond will experience greater price percentage change if yield to maturity increases by 1%?
What is the percentage price change in Bond A if yield to maturity increases by 1%? (Note: please answer using numbers only)
What is the percentage price change in Bond B if yield to maturity increases by 1%? (Note: Please answer using numbers only)
5.5.2 Default Risk
Apart from interest rate risk, bond also carries default risk, especially for corporate bonds.
As we have seen, when a company or government issues debt, they are obliged to both repay the face value of that debt at the time of maturity, and, for non-zero-coupon bonds, make periodic interest payments to the debt holders. Failure to meet this obligation, or violate an agreed-upon debt covenant, results in default. Default may, in turn, result in bankruptcy, a legal process whereby creditors work with authorities to manage the finances of a firm that has defaulted. Default represents a risk to investors in bonds and, as is the case with any marketable security, the investors will adjust their required return to compensate for this risk.
Credit rating agencies such as Fitch, Moody’s, and Standard & Poor’s specialise in measuring default risk and sell this data to investors (see table below). The credit ratings generally range between triple A (minimal default risk) to D (in default with little chance of recovery). The terms “investment grade” and “speculative grade” are often used to describe if a company is subject to low to moderate credit risk (investment grade) or substantial to very high credit risk (speculative grade).
| Moody's | S&P | Fitch | Rating description | |
|---|---|---|---|---|
| Aaa | AAA | AAA | Prime | Investment-grade |
| Aa1 | AA+ | AA+ | High grade | |
| Aa2 | AA | AA | ||
| Aa3 | AA− | AA− | ||
| A1 | A+ | A+ | Upper medium grade | |
| A2 | A | A | ||
| A3 | A− | A− | ||
| Baa1 | BBB+ | BBB+ | Lower medium grade | |
| Baa2 | BBB | BBB | ||
| Baa3 | BBB− | BBB− | ||
| Ba1 | BB+ | BB+ | Non-investment grade speculative | Non-investment grade AKA high-yield bonds AKA junk bonds |
| Ba2 | BB | BB | ||
| Ba3 | BB− | BB− | ||
| B1 | B+ | B+ | Highly speculative | |
| B2 | B | B | ||
| B3 | B− | B− | ||
| Caa1 | CCC+ | CCC | Substantial risks | |
| Caa2 | CCC | Extremely speculative | ||
| Caa3 | CCC− | Default imminent with little prospect for recovery | ||
| Ca | CC | |||
| C | ||||
| C | D | DDD | In default | |
| / | DD | |||
| D | ||||
Table: Adapted from Bond credit rating, CC BY-SA 4.0 via Wikipedia.
Exercise
All else equal, are investors willing to pay more or less for an investment-grade bond compared to a bonds of speculative grade?
5.5.3 Yield to Maturity
Investors require a certain yield to maturity and this yield is, in general, determined by four factors:
- The real interest rate,
- Expectations about the future rate of inflation,
- The interest rate risk premium (the compensation investors require for bearing the risk associated with changes in the interest rate),
- The default risk/credit risk premium (the compensation investors require for bearing risk associated with default).
An interesting problem occurs in trying to determine the yield to maturity of a bond for which you know the face value, coupon rate, and maturity.
You might guess that if r were the unknown value, you would not be able to solve for it explicitly using the bond value equation. Interestingly, bond prices are usually what are observed in the market, and from this we can infer what the interest is that the market requires on the bond. It is not so easy to calculate the yield to maturity (YTM), and the easiest way to solve for the YTM is using a financial calculator or the YIELD function in excel.
The yield to maturity can be also be found manually using trial and error or by approximation. These methods are included in the Appendix (we will not require you to employ either of these two methods in the exam, but having a look at these two methods can enhance your understanding).
In Excel, you can also use the YIELD function to solve for Yield to Maturity. Assume we have the following bond outstanding
- 10-year maturity (assume today is 1/1/2020)
- A coupon rate of 10%, paid annually
- Face value of $100
- Current price is $107.5
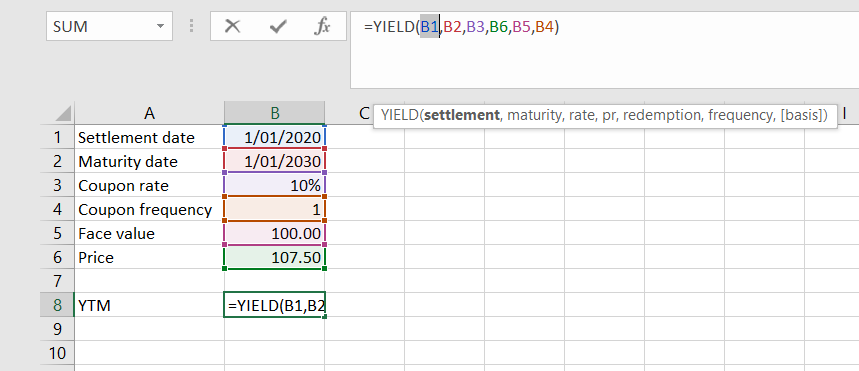
For this simple example, the Yield to Maturity is 8.84%
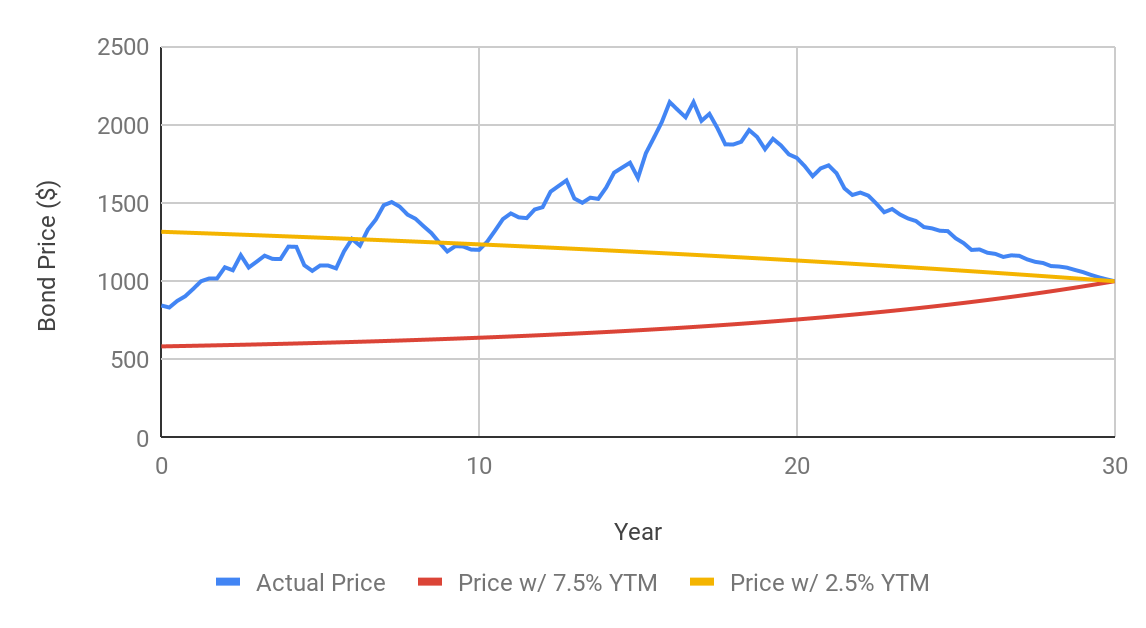
5.5.3.1 Graphing Bond Price vs Yield to Maturity
The following chart show how the price of a bond can fluctuate over time according to the yield to maturity and the time to maturity. In this example we are looking at a 30 year, $1000 face value bond with a coupon rate of 4%. The bond makes quarterly coupon payments. The blue line shows how bond prices may actually fluctuate in the market. The graph also shows how the price of two bonds with different constant YTM’s (2.5% and 7.5%) change over time and eventually converge to their face value. Note that in real life, it is extremely unlikely that a bond’s yield to maturity stays constant throughout its life.
5.5.4 Want to Know More?
The trial and error method involves calculating the hypothetical price of the bond for various yield to maturity values to find which yield results in the true market price. So for example, suppose Wayne Enterprises issues a 10-year bond with a face value of $1000 and a coupon rate of 8.25%. If this bond is selling for $1165.60, what is its yield to maturity?
To answer this question we can construct the following table
|
Coupon Rate |
n |
YTM |
Face Value |
PV(face) |
PV(coupon) |
Price |
|---|---|---|---|---|---|---|
|
8.25% |
10 |
1.00% |
$1,000 |
$905.29 |
$781 |
$1,686.67 |
|
8.25% |
10 |
1.50% |
$1,000 |
$861.67 |
$761 |
$1,622.50 |
|
8.25% |
10 |
2.00% |
$1,000 |
$820.35 |
$741 |
$1,561.41 |
|
8.25% |
10 |
2.50% |
$1,000 |
$781.20 |
$722 |
$1,503.24 |
|
8.25% |
10 |
3.00% |
$1,000 |
$744.09 |
$704 |
$1,447.84 |
|
8.25% |
10 |
3.50% |
$1,000 |
$708.92 |
$686 |
$1,395.04 |
|
8.25% |
10 |
4.00% |
$1,000 |
$675.56 |
$669 |
$1,344.71 |
|
8.25% |
10 |
4.50% |
$1,000 |
$643.93 |
$653 |
$1,296.73 |
|
8.25% |
10 |
5.00% |
$1,000 |
$613.91 |
$637 |
$1,250.96 |
|
8.25% |
10 |
5.50% |
$1,000 |
$585.43 |
$622 |
$1,207.28 |
|
8.25% |
10 |
6.00% |
$1,000 |
$558.39 |
$607 |
$1,165.60 |
|
8.25% |
10 |
6.50% |
$1,000 |
$532.73 |
$593 |
$1,125.80 |
|
8.25% |
10 |
7.00% |
$1,000 |
$508.35 |
$579 |
$1,087.79 |
|
8.25% |
10 |
7.50% |
$1,000 |
$485.19 |
$566 |
$1,051.48 |
|
8.25% |
10 |
8.00% |
$1,000 |
$463.19 |
$554 |
$1,016.78 |
|
8.25% |
10 |
8.50% |
$1,000 |
$442.29 |
$541 |
$983.60 |
|
8.25% |
10 |
9.00% |
$1,000 |
$422.41 |
$529 |
$951.87 |
|
8.25% |
10 |
9.50% |
$1,000 |
$403.51 |
$518 |
$921.52 |
|
8.25% |
10 |
10.00% |
$1,000 |
$385.54 |
$507 |
$892.47 |
We can see that a yield to maturity of 6% results in the correct price. The yield to maturity may also be approximated by the following formula:
[latex]Y T M \text { approx.}=\left(C+\frac{F-P}{t}\right) \div\left(\frac{F+P}{2}\right)[/latex]
where C is the coupon payment, F is the face value, P is the market price of the bond, and t is the time to maturity. Now, the yield to maturity is essentially a rate of return and so it should be calculated by something that looks like
[latex]\frac{\text {Final Value - Initial Value}}{\text {Initial Value}}[/latex]
Here the numerator represents a gain and the denominator allows this gain to be expressed as a proportion of the initial investment. If we compare this with our approximation formula we can see that the numerator does resemble a gain: it considers the annual coupon payment and the average annual capital gain (or loss). The denominator is an estimate of the average investment. So the approximation for the yield to maturity resembles a rate of return, as it should.
Using the approximation formula we can find the yield to maturity for Wayne Enterprises' bond above:
[latex]Y T M \text { approx.}=\left(\$ 82.5+\frac{\$ 1000-\$ 1165.60}{10}\right) \div\left(\frac{\$ 1000+\$ 1165.60}{2}\right)=6.09 \%[/latex]
...which is a pretty good approximation to what we found using the trial and error method. Often, the approximate formula can help to inform the range of yield to maturity values that you will use in the trial and error.
5.6 Summary & Key Formulas
5.6.1 Summary
In this chapter, we focus on how to value debt, in particular, bond. We have learnt different type of bonds and their key features. More importantly, we know that the value of bond equals the present value of future coupon payment plus the present value of face value. In calculating bond value, it is important to distinguish between coupon rate and yield to maturity. While coupon rate is set at the issuance and does not change over the life of the bond, yield to maturity fluctuates day to day reflecting investor’s risk assessment on the bond.
There are two key risks involved in bond investment, and reflected in the yield to maturity. First, as we have seen from this chapter, there is an inverse relationship between bond price and interest rate, which means bond carries interest rate risk. Second, the promised payment (coupon or face value) may not eventuate. That is, companies may default on their bonds outstanding. For this reason, corporate bond carries default risk. Higher default risk is reflected in higher yield to maturity, and hence, lower bond price.
5.6.2 Key Formulas
Bond value formula:
[latex]Bond Value =C \times\left[\frac{1-[1 /(1+r)^{n}]}{r}\right]+\frac{\text { Face Value }}{(1+r)^{n}},[/latex]
[latex]where\: : C=\frac{\text { coupon rate }}{\text { number of coupons per year }} \times Face Value[/latex]
