29 Sampling, data collection, and data analysis in quantitative research
Learning objectives
- Describe levels of measurement.
- Describe reliability and validity as applied to critical appraisal of research.
- Differentiate methods of obtaining samples for population generalisability.
- Describe common data collection methods in quantitative research.
In this chapter, we will focus on how quantitative research collects and analyses data, as well as methods for obtaining sample population.
Statistical significance versus clinical significance
Levels of measurement
Once researchers have collected their data, they need methods to organise the data before they even start to think about statistical analyses. Statistical operations depend on a variable’s level of measurement. Think about this similarly to shuffling all of your bills in some type of organisation before you pay them. With levels of measurement, we are precisely recording variables in a method to help organise them.
The four levels of management are:
-
- “Nominal: The data can only be categorised
- Ordinal: The data can be categorised and ranked
- Interval: The data can be categorised, ranked, and evenly spaced
- Ratio: The data can be categorised, ranked, even spaced, and has a natural zero” (Bhandari, 2023).
Visit Nominal, ordinal, interval, and ratio data for more details about each level.
Reliability and Validity
| Term | Definition | Importance | Application |
|---|---|---|---|
| Reliability | Measures the ability of a measure to consistently measure the same way | This is important for consistent measures of a construct. | For example, when measuring a patient’s blood pressure, the blood pressure cuff should consistently measure in the same way. So, when doing every 15-minute vital signs after surgery, the blood pressure cuff should measure consistently every 15 minutes. |
| Validity | Measures the concept it is supposed to measure | This is important to be able to measure the intended construct. | For example, a measure of critical thinking is an accurate measure of critical thinking and not expert practice. Another example: a measure of stress level should measure stress level, not pain level. |
“Reliability and Validity” table in “The Art and Science of Evidence Based Practice in Nursing” by Nancyruth Leibold, published under CC BY-NC 3.0
Obtaining samples for population generalisability
In quantitative research, a population is the entire group that the researcher wants to draw conclusions about. A sample is the specific group that the researcher will actually collect data from. A sample is always a much smaller group of people than the total sise of the population. For example, if we wanted to investigate heart failure, there would be no possible way to measure every single human with heart failure. Therefore, researchers will attempt to select a sample of that large population which would most likely reflect (AKA: be a representative sample) the larger population of those with heart failure. Remember, in quantitative research, the results should be generalisable to the population studied.
A researcher will specify population characteristics through eligibility criteria. This means that they consider which characteristics to include (inclusion criteria) and which characteristics to exclude (exclusion criteria).
For example, if we were studying chemotherapy in breast cancer subjects, we might specify:
- Inclusion Criteria: Postmenopausal women between the ages of 45 and 75 who have been diagnosed with Stage II breast cancer.
- Exclusion Criteria: Abnormal renal function tests since we are studying a combination of drugs that may be nephrotoxic. Renal function tests are to be performed to evaluate renal function and the threshold values that would disqualify the prospective subject is serum creatinine above 1.9 mg/dl.
Sampling designs
There are two broad classes of sampling in quantitative research: Probability and nonprobability sampling.
Probability sampling
As the name implies, probability sampling means that each eligible individual has a random chance (same probability) of being selected to participate in the study. There are three types of probability sampling:
- Simple random sampling: Every eligible participant is randomly selected (e.g. drawing from a hat).
- Stratified random sampling: Eligible population is first divided into two or more strata (categories) from which randomisation occurs (e.g. pollution levels selected from restaurants, bars with ordinances of state laws, and bars with no ordinances).
- Systematic sampling: Involves the selection of every __th eligible participant from a list (e.g. every 9th person).
Nonprobability sampling
In nonprobability sampling, eligible participants are selected using a subjective (non-random) method. There are four types of nonprobability sampling:
- Convenience sampling: Participants are selected for inclusion in the sample because they are the easiest for the researcher to access. This can be due to geographical proximity, availability at a given time, or willingness to participate in the research.
- Quota sampling: Participants are from a very tailored sample that’s in proportion to some characteristic or trait of a population. For example, the researcher could divide a population by the state they live in, income or education level, or sex. The population is divided into groups (also called strata) and samples are taken from each group to meet a quota.
- Consecutive sampling: A sampling technique in which every subject meeting the criteria of inclusion is selected until the required sample size is achieved.
- Purposive sampling: A group of non-probability sampling techniques in which units are selected because they have characteristics that the researcher needs in their sample. In other words, units are selected “on purpose” in purposive sampling.
| Characteristics | Probability sampling | Non-probability sampling |
|---|---|---|
| Sample selection | The sample is selected at random. | Sample selection based in the subjective judgment of the researcher. |
| Selection chances | Everyone in the population has an equal chance of getting selected. | Not everyone has an equal chance to participate. |
| Sampling bias | Used when sampling bias has to be reduced. | The researcher does not consider sampling bias. |
| Sample accuracy | Used to create an accurate sample. | The sample does not accurately represent the population. |
| Respondents | Finding the right respondents is not easy. | Finding respondents is easy. |
| Population | Used when the population is diverse. | Useful when the population has similar traits. |
Common data collection methods in quantitative research
There are various methods that researchers use to collect data for their studies. For nurse researchers, existing records are an important data source. Researchers need to decide if they will collect new data or use existing data. There is also a wealth of clinical data that can be used for non-research purposed to help answer clinical questions.
Let’s look at some general data collection methods and data sources in quantitative research.
Existing data could include medical records, school records, corporate diaries, letters, meeting minutes, and photographs. These are easy to obtain and do not require participation from those being studied.
Self-reports can be obtained via interviews or questionnaires. Closed-ended questions can be asked e.g. “Within the past 6 months, were you ever a member of a fitness gym?” Yes/No or open-ended questions such as “Why did you decide to join a fitness gym?”
Advantages of questionnaires (compared to interviews)
- Questionnaires are less costly and are advantageous for geographically dispersed samples.
- Questionnaires offer the possibility of anonymity, which may be crucial in obtaining information about certain opinions or traits.
Advantages of interviews (compared to questionnaires)
- Higher response rates
- Appropriate for more diverse audiences
- Some people cannot fill out a questionnaire.
- Opportunities to clarify questions or to determine comprehension
- Opportunity to collect supplementary data through observation
Psychosocial scales are often utilised within questionnaires or interviews. These can help to obtain attitudes, perceptions, and psychological traits.
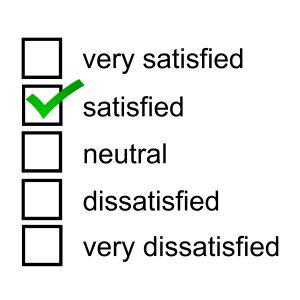
Likert Scales
- Consist of several declarative statements (items) expressing viewpoints
- Responses are on an agree/disagree continuum (usually five or seven response options).
- Responses to items are summed to compute a total scale score.

Visual Analog Scale
- Used to measure subjective experiences (e.g. pain, nausea)
- Measurements are on a straight line measuring 100 mm.
- End points labelled as extreme limits of sensation.

Observational methods
Observational methods include the observation method of data collection involves seeing people in a certain setting or place at a specific time and day. Essentially, researchers study the behavior of the individuals or surroundings in which they are analysing. This can be controlled, spontaneous, or participant-based research. When a researcher utilises a defined procedure for observing individuals or the environment, this is known as structured observation. When individuals are observed in their natural environment, this is known as naturalistic observation. In participant observation, the researcher immerses himself or herself in the environment and becomes a member of the group being observed.
Biophysiologic measures
Biophysiologic Measures are defined as ‘those physiological and physical variables that require specialised technical instruments and equipment for their measurement’. Biophysiological measures are the most common instruments for collecting data in medical science studies. To collect valid and reliable data, it is critical to apply these measures appropriately.
- In vivo refers to when research or work is done with or within an entire, living organism. Examples can include studies in animal models or human clinical trials.
- In vitro is used to describe work that’s performed outside of a living organism. This usually involves isolated tissues, organs, or cells.
Critical Appraisal: Quantitative sampling and data collection
- Did the researchers use the best method of capturing study phenomena (i.e. self-reports, observation, biomarkers)?
- If self-report methods were used, did the researchers make good decisions about the specific methods used to solicit information (e.g. in-person interviews, Internet questionnaires, and so on)? Were composite scales used? If not, should they have been?
- If observational methods were used, did the report adequately describe what the observations entailed and how observations were sampled? Were risks of observational bias addressed? Were biomarkers used in the study, and was this appropriate?
- Did the report provide adequate information about data collection procedures (e.g. the training of the data collectors)?
- Did the report offer evidence of the reliability of measures? Did the evidence come from the research sample itself, or was it based on other studies? If reliability was reported, which estimation method was used? Was the reliability sufficiently high?
- Did the report offer evidence of the validity of the measures? If validity information was reported, which validity approach was used?
- If there was no reliability or validity information, what conclusion can you reach about the quality of the data in the study?
References
Bhandari, P. (2022). Levels of measurement: Nominal, ordinal, interval and ratio. Scribbr. https://www.scribbr.com/statistics/levels-of-measurement/
Polit, D. & Beck, C. (2021). Lippincott CoursePoint Enhanced for Polit’s Essentials of Nursing Research (10th ed.). Wolters Kluwer Health.
This chapter is adapted from “Sampling, data collection, and data analysis in quantitative research” in “Evidence-Based Practice and Research Methodologies” by Tracy Fawns, is used under a Creative Commons Attribution-NonCommercial-ShareAlike 4.0 International License, except where otherwise noted.

