
Introduction
This book has been written for introductory courses in data analysis and statistical modelling, with a particular emphasis on scientific and clinical research. It is also intended to be an introductory guide for secondary teachers in science and mathematics.
For many students and teachers, you may have only seen “statistics” as a topic in a mathematics class, but what is statistics in the context of this book?
Statistics
Statistics is not mathematics. There is a lot more to statistical data analysis than mathematics, including a range of ideas and methods about how to design experiments, how to think about variability, and how to think about and communicate results. Higgins (1999) gives the following quote by the eminent statistician George Box which captures this idea perfectly:
Statistics is, or should be, about scientific investigation and how to do it better, but many statisticians believe it is a branch of mathematics… Now I agree that the physicist, the chemist, the engineer, and the statistician can never know too much mathematics, but their objectives should be better physics, better chemistry, better engineering, and in the case of statistics, better scientific investigation. Whether in any given study this implies more or less mathematics is incidental.
However we do not hide the mathematics in this book. There are two reasons for doing this:
- As scientists or health professionals you should avoid a “black box” view of statistical methods in general and of statistical software in particular. You certainly don’t need to learn all of the mathematics involved but you should see it once and appreciate that these methods are not magical, and that they have certain specific assumptions and limitations.
- Degree programs are fairly crowded these days and you may not have a chance to do a “real” mathematics course at university. This is unfortunate as a new revolution in mathematics applications is occurring in the biological and medical sciences and research in these areas is becoming increasingly mathematical. Students who have some background in mathematics will have greater flexibility in careers in later life. In case you cannot do a specific mathematics course we hope that the mathematics used in this book will at least keep you in touch with what you learnt in school.
Structure
The content is presented in three parts:
- Exploring Data begins with an overview of the nature of data and then shows a range of common visualisations for exploring patterns and relationships. These are then support by summary statistics, such as the mean and standard deviation, to capture the patterns and relationships we see.
- We then take a brief detour in Understanding Randomness to see how we can use the language of probability to help describe the processes that produce data. Probability is discipline in its own right – here we only cover the key ideas that we need for statistical inferences.
- In Making Inferences we then combine these ideas, understanding the statistics we calculate from data as the outcome of random processes. This allows us to make inferences from data to address a wide range of research questions.
The chapters in each part contain examples and exercises. Detailed solutions to the exercises are given at the end of the book.
Statistical Tables
This book was written to be independent of particular statistical software and so no code or instructions are given. Instead, a wide range of statistical tables are included throughout the book. There are two reasons for having these tables. Firstly, they give you an opportunity to browse the kinds of values you might see when working with these distributions, to help give you more of an instinct as to what values are significant. Secondly, they are here so that you can study without the aid of the software, since the aim of this book is to be portable. Of course tables like these are usually not needed in practice. We typically use computer software, such as R, to do the other statistical calculations and so it makes sense to get them to calculate the probabilities that are found in these tables as well.
The Islands
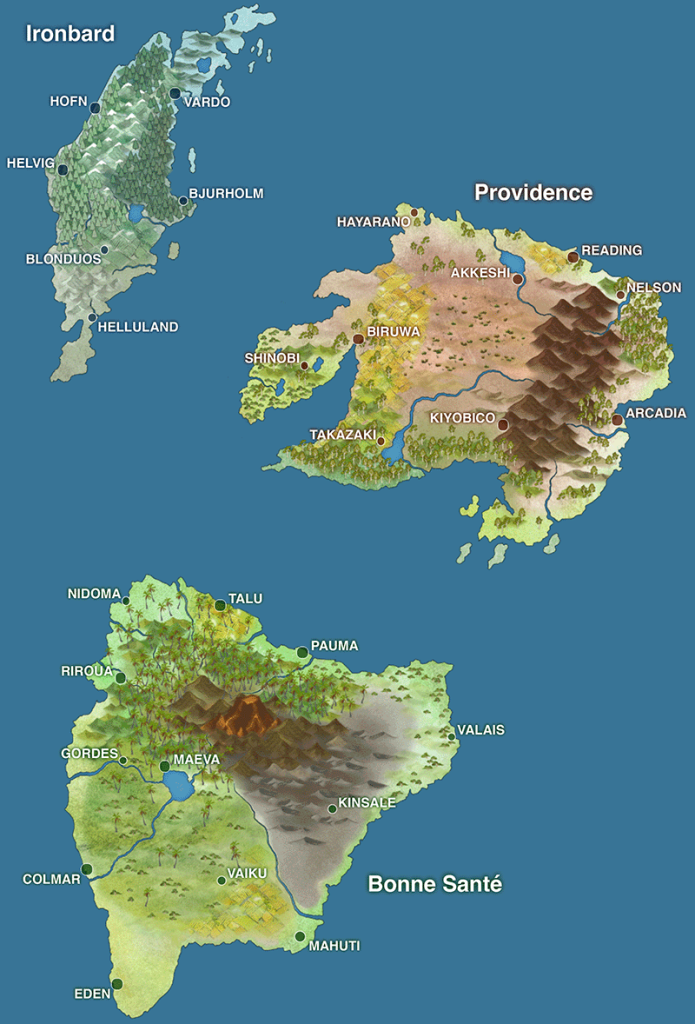
To avoid issues with data privacy, many examples in this book are taken from the fictional world of The Islands. While fictional, these data examples have been simulated to match results from real literature.
The following map may be useful in providing context for several of the examples.
Acknowledgements
This Open Textbook edition would not exist without the expert assistance of Finn Thompson in converting the original book into the online format. Thanks also to Thomas and the rest of the staff at the UQ Library for their support.
The book itself would also not have been possible without the feedback from previous students and the data sets shared from their experimental work in courses at UQ. The examples and exercises include data from work by David Armour, Shaun Bearcock, Tanya Bradford, Kelly Cosgrove, Travis Driessen, Rebecca Ferris, James Hardy, Rebecca Hobbs, Rosalyn Hunt, Shauna Purser, Eliza Smith, Tamaryn Watermeyer, Rebecca Yaun and Laurie Zhong, as well as other authors who wished to remain anonymous.
This publication of A Portable Introduction to Data Analysis was supported by an Open Textbooks @ UQ grant from UQ Library.
