
Chapter 13: Guidelines to CBA Report Writing
Learning Objectives
After completing this chapter, students should be able to:
-
Understand what makes a report an effective communication tool.
-
Create a CBA report including all relevant components.
Guidelines to CBA Report Writing.
In this chapter, we discuss the details relating to how to write a CBA report. As mentioned in Appendix Chapter A1: Context Matters!, there are 9 stages involved in the evaluation process for a CBA. When communicating the results, it is imperative that we bring all 9 components together into a report for the policymaker or decision-maker that requested the CBA.
Why is a CBA Report So Important?
As we now understand, CBA is an important tool for decision-making. The results of the analysis conducted as part of the evaluation process is intended to inform the decision-making process. Therefore, it is important that the results are communicated in a manner that is useful to the decision-maker.
- From a private business perspective, the CBA report will provide an indication on whether a project has a sound business case, considering taxes, depreciation, and loans involved.
- From a government perspective, it allows for the evaluation of allocative efficiency by determining the projects with the highest social net benefit (where the social benefit exceeds the social cost).
Key Steps to be Included in the CBA Report.
As previously mentioned, we must ensure the report clearly outlines all 9 stages of the CBA process outlined below:
- Specify the options or set of alternatives under consideration.
- Decide whose benefits and costs count.
- Identify the impacts and select measurement indicators.
- Predict the impacts over the life of the proposed project, program, or policy.
- Monetise all impacts (attach $ values).
- Discount future costs and benefits to obtain present values.
- Compute the net present value (NPV) of each project.
- Perform a sensitivity analysis.
- Reach a conclusion.
However, it is not necessarily clear where to include the information for each of these steps in the report itself. There are no set rules for incorporation of these stages in the report. However, the following is suggested in Table 13.1 below:
What to Keep in Mind When Writing the Report?
There are four aspects that should be clearly demonstrated within the body of report itself:
- Scope of the problem. What policies will follow the implementation of the recommendations of the CBA from a public sector perspective. Provide an explanation on the need or importance of the project policy or program under evaluation. The background and relevance of the context – this should relay only the most important information that is relevant to the project, policy, or program under evaluation.
- The analysis directly related to the decision-making – including any assumptions made and their implications.
- The context in which the decision should be made – specifically how the CBA acts as a decision-making tool.
- A clearly defined final recommendation – remember that decisions are made by policymakers. Recommendations are made by CBA analysts. A CBA is only one input into the decision-making process. In the real-world, the policymaker is responsible for the final decision. There are many factors that may influence the final decision to undertake the project from a resourcing, political, or social perspective.
Report Structure – General Aspects.
Report writing often varies depending on the context for which the report is written. Many government departments and consulting groups will provide templates to use in a professional context. The examples provided in this chapter are for general information and to help improve your writing style. Some key things to note about reports:
- A good report has a clear structure and is written in sections (first level headings), with subsections (second level headings). This is very different to how you would approach an essay. In an essay you are developing an argument. In a report, the use of section headings and subheadings allows the reader to read only the perceived relevant sections of the analysis.
- Dot points are okay to use in a report – however you should not overuse dot points.
- Tables and figures are best to communicate numerical results (see Example 13.1 and 13.2). Ensure all tables and figures have captions and headings. Remember the basics from your statistics and quantitative methods courses!
- Remember the basics of paragraph writing. For some assistance, refer to this free online text by Williamson (2021).
A general structure for a report includes the following components:
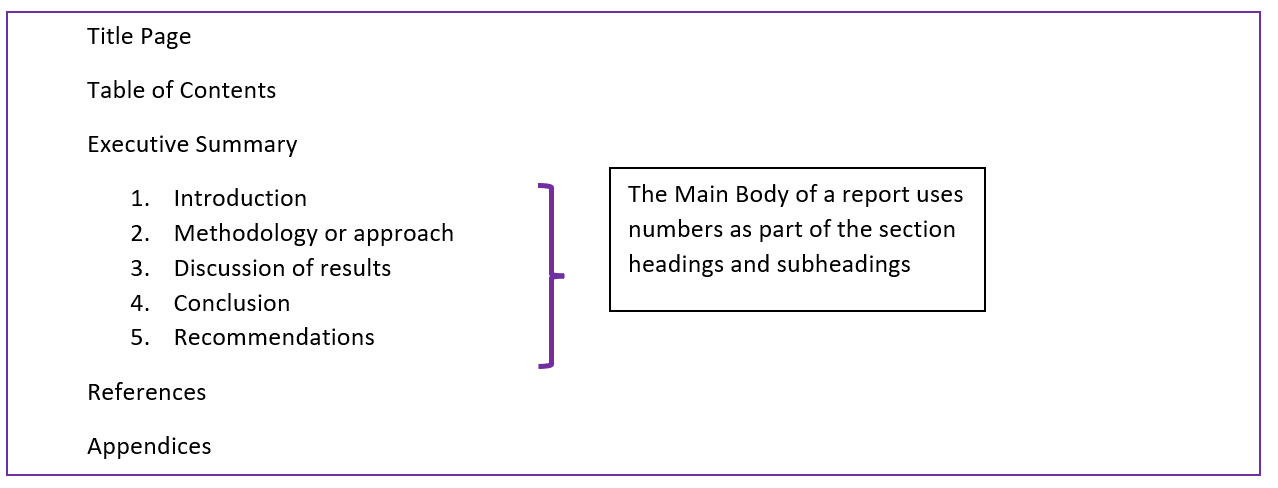
A report can also have additional sections to cover literature reviews, theoretical frameworks, list of figures, list of tables, and acronyms where appropriate. Only sections in the main body use headings and subheadings. The use of headings and subheadings is to provide a clear trajectory to the reader of your report.
Title Page
The title page should include the report title along with the details of the authors.
If the report you are writing is for assessment purposes you should include the course code, student numbers and the word count of the final submission. An example of how you can format the title page is shown in Figure 13.2. Keep in mind that you can use Microsoft Word templates to generate a general report structure to make it easier to implement a report format.

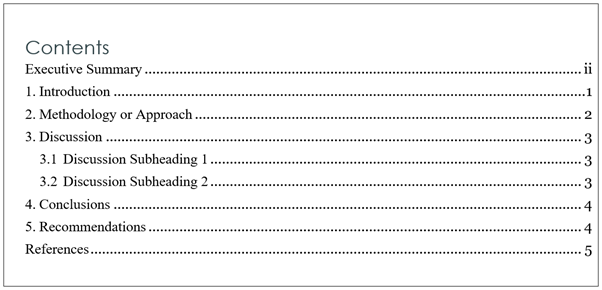
Table of Contents
The table of contents should provide the reader with page numbers associated with various sections of the report. Usually, the table of contents captures list of the first level headings and often also the second level subheadings of a report. As a rule of thumb, third level subheadings are not usually provided in the table of contents unless the report is significantly large. An example of a traditional table of contents can be seen in Figure 13.3. Note the use of Roman numerals for the executive summary followed by standard numbering for the body of the report.
Report Structure – CBA Specific Aspects.
Executive Summary
An executive summary in the context of a CBA should be a non-technical summary of the overall scope and purpose of the report. Within the context of CBA, the executive summary should cover the project under consideration (and any alternatives), the approach to the analysis, the main results, and the final key recommendation. This section of the report is usually written last.
In practice, an executive summary should not exceed one page. When writing a report for assessment purposes it is best to limit the executive summary between 100 -200 words depending on the total word limit of the assessment.
Note that the executive summary heading is not numbered, and page numbers start with roman numerals to indicate it is the preface of the report.
The Main Body of the Report
Remember that the main body of the report should use headings and subheadings that utilise numbering. In the context of a CBA there are key elements that should be covered in each section:
- Introduction
The introduction should provide a brief summary of the report. In the introduction you should cover the relevant but brief background context for why the CBA is necessary, identify the options associated with the project under evaluation – which involves explicitly identifying the base case scenario or the status quo. Finally, the introduction should also provide information on the context on how the CBA recommendations can inform the final decision.
The introduction is separate from the executive summary. The executive summary should give an overview of the whole report.
- Methodology or approach
The methodology section will depend on the nature of your report. In the context of a CBA report, you should identify the approach to the CBA along with describing key variables and assumptions. Obviously, the approach to a private project appraisal would be different to the evaluation of a change in climate change policy or a healthcare intervention. However, there are some key components you should cover in this section:
– Highlight how the impacts are predicted and then monetised as part of the CBA.
– Provide information on the discounting approach used for the project.
– Identify with whether the analysis was conducted using real (constant year 0) or nominal values (accounting for inflation and/or growth rates).
– Include a clear indication on the decision rule that will be used to drive the recommendation process. This is key as the reader of the CBA may not have sufficient knowledge to infer why the recommendation is being made. Therefore, you should ensure that you provide a clear and concise understanding of the decision rule being adopted to evaluate the net social benefit.
– Outline any assumptions relevant to the calculations of impacts. However, leave discussion of the consequences of these assumptions to the discussion or conclusion section.
– Identify all the effects including those that were monetised as well as those that may have been excluded from the monetisation process due to difficulties.
- Discussion of results
The discussion section of the report is often the longest and most detailed section. In this section you should critically analyse the findings of the analysis you conduced in the spreadsheet or CBA toolkit used.
In a CBA report you should ensure that you discuss:
– Provide a concise breakdown of the results including the key metrics for the evaluation. Remember that you may not need to report all aspects. However, tables and figures can be used to compress and synthesise information. It is also important to ensure that the magnitude of the results and the currency is reported in each table.
– Which project(s) should be accepted and why? Clearly emphasise any decision rules yes. Ensure this is outlined relative to the base case scenario or status quo.
– Would there be alternative public or private sector entities that may be interested in the project or may be opposed to the project undertaken.
– Are there any distributional impacts that should be considered i.e., are any stakeholders impacted un-equitably?
Finally, in this section you should also include the results of the sensitivity analysis you should have conducted (per Chapter 9). Every CBA should have a sensitivity analysis as there is considerable uncertainty regarding the predicted impacts. In the sensitivity analysis you should evaluate any of the inputs into the CBA that may significantly impact the estimated net social benefit. Influential variables should be clearly identified and the impacts of changes in those variables should be discussed – especially if there is a significant change to the net present value. Again, one of the easiest ways to present the results of a sensitivity analysis is the use of a matrix or table.
In terms of constructing the sensitivity analysis, it is often best practice to separate the those controllable(endogenous) and uncontrollable(exogenous) aspects of the project. For example, if we are considering a farming project a controllable component would be units of labour used, whereas an uncontrollable input could be the size of the crop as it depends on the weather the farm experiences.
Remembering that the sensitivity analysis allows us to somewhat account for uncertainty, you should ensure there is also a clear conclusion on whether the recommendation changes based on the sensitivity analysis conducted.
- Conclusion
Like the conclusion of an essay, the conclusion of the report should reinforce the relevant aspects of the report body to form an argument. The argument should directly support the recommendation to accept or reject the project relative to the base case scenario or status quo.
In writing the conclusion, you should not only refer to the results of the analysis in the previous section, but also set the results of the decision rule context of the literature and any limitations of the methodology used for the CBA.[1] Consequently, this section should highlight the impact of any assumptions made.
- Recommendations
The recommendations section of a CBA report provides an opportunity to suggest solutions to the implications of problems highlighted in the discussion or conclusion section of your CBA. The recommendations can be related to specific actions such as how to reduce risk or uncertainty with a project and/or suggestions for further research when impacts were excluded from the analysis.
Ensure your final recommendation is communicated in a way that the implications are clear to the decision-maker – again remember the communication of these results should be appropriate to the audience you are writing for. Consider whether the audience is informed in CBA, or if the reader is not aware of the method.
Ensure any assumptions, limitations, or areas for further investigation are highlighted in this section. If there were any specific impacts excluded from the monetisation process or strict assumptions were made, you should highlight these for the reader – especially if the assumptions may significantly change the net social benefit. If key impacts are excluded due to limited time for the evaluation of the CBA ensure you determine whether the results of the CBA would be an upper bound or lower bound estimate of the net social benefit.
Finally, provide a clear justification of the recommendation based on the decision criteria used – should the project be accepted, rejected, or even possibly improved. When considering more than one alternative projects, be clear on which project is preferred. The recommendation should also consider whether the evaluation of distributional effects (winners and losers) should be considered as part of the decision process. Specifically, when evaluating public policy using CBA it is important to consider the Kaldor-Hicks criteria as well as any possible unintended consequences from the implementation of a policy. At this point, it is also important to highlight any ethical or social implications of the final decision to ensure full information is conveyed to the decision-maker.
The Difference Between Conclusions and Recommendations
There is an important difference between the conclusion and the recommendation sections of a report. Every report must have a conclusion section, but not all reports will have a recommendations section. A conclusion is based on the data analysed as part of the report. When including a recommendation section, you are reaching beyond the scope of the data analysed in the CBA. The length of both the conclusion and recommendation sections depends on the context of the CBA and the depth of analysis conducted.
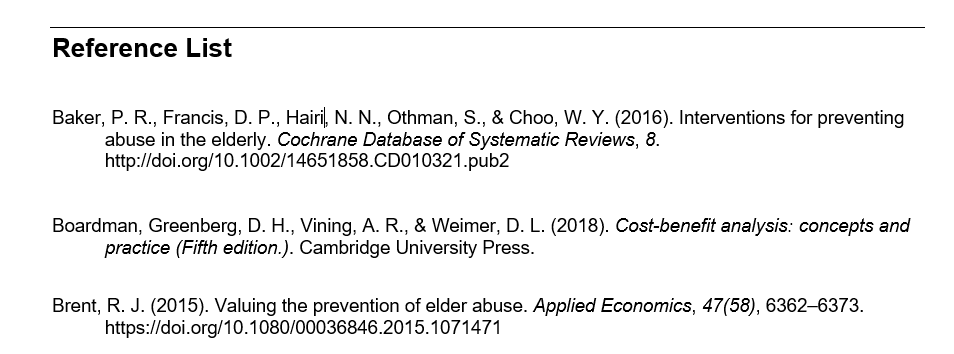
References and Appendices
All reports should have a reference list. It is important that you are consistent with your reference list formatting. The UQ referencing guide is helpful for formatting and provides quality examples for all possible scenarios. For alternative institutions, it is best to refer to the relevant library resources. Remember that reference lists at the end of a report need to have the second line indented as shown in Figure 13.4.
Appendices are included after the reference list and should be labelled Appendix 1, Appendix 2, and so on. When your report is for the purpose of assessment, ensure you check whether appendices are allowed or contribute to the word count.
Formatting
Formatting is an important aspect of writing a report. You should consider the font size, line spacing, margins, paragraph format, structure, and page numbers when writing your report. Remember that the report should be easy for the decision-maker to review and understand.
Know Your Audience.
The audience of your report will depend on who commissioned the report. Before writing, consider the objective of the report and the context of those who will be reading the report. Again, at this point it is important to remember that a CBA analyst’s role is to make recommendations based on the analysis, rather than making decisions. There are three main sectors CBA is written for: (1) private sector, (2) public sector, and (3) non-profit organisations.
Private Sector
If the report is for a private firm, the report should be written from a financial/economic appraisal approach rather than a social CBA approach. Remember that in accordance with basic economics, firms seek to maximise profits. Keep in mind any possible reputational issues a project may cause. For example, if a firm is considering a factory there may be negative externalities such as pollution costs to society that can have a negative impact on the firm’s reputation.
Public Sector
If the government has commissioned the report, you should emphasise the social cost-benefit analysis results. Consider all non-market valuations used to correct market failures. Furthermore, it is important for a government perspective to identify distributional impacts and any “at risk” stakeholders.
Non-Profit Organisations
Similar to the public sector not-for-profit organisations face a challenge not commonly found among their private sector counterparts. If the report is for a not for profit, you should consider all relevant aspects in the cost-benefit analysis from a social CBA perspective.
Keep in mind that the audience for many CBA’s can also vary depending on the topic. For example, a cost-benefit analysis on healthcare interventions will be fundamentally different to a cost-benefit analysis on the provision of a public good by a government entity.
Draft, Draft, Draft.
Like all things to do with writing, the first draft is never the finished product. Time should be spent reviewing, refining, and rewriting the report. Through engaging in the drafting process, you can refine the topic, purpose, audience, and context of the report.
Example 13.1
As part of a CBA report, it is crucial to consider the display of information. For example, graphs can be useful in communicating the results of a sensitivity analysis. Suppose we return to example 10.4 from Chapter 10. An example of how the information from the partial sensitivity analysis could be graphed is illustrated in Figure 13.1 below.
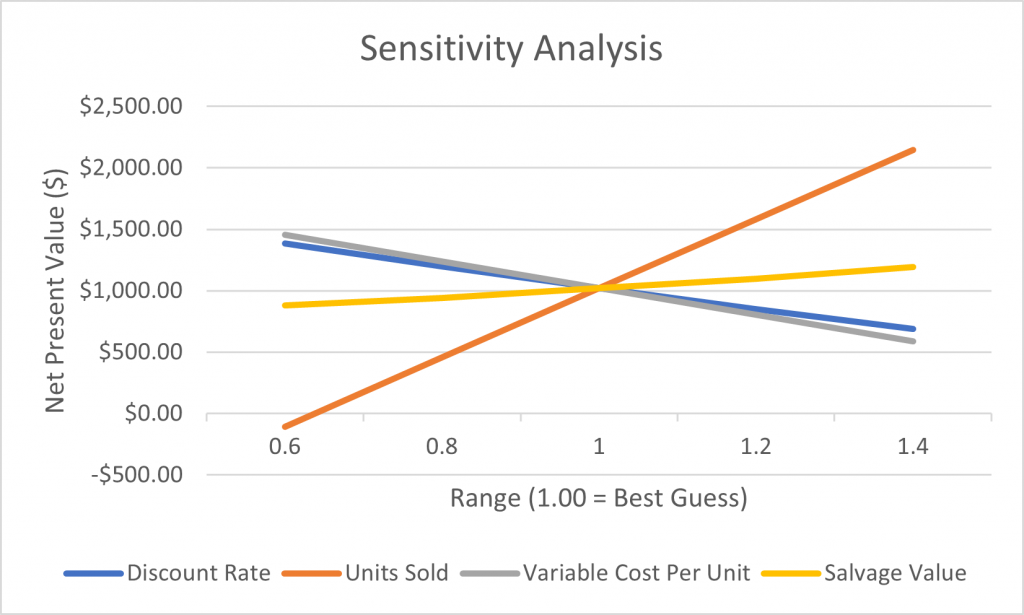
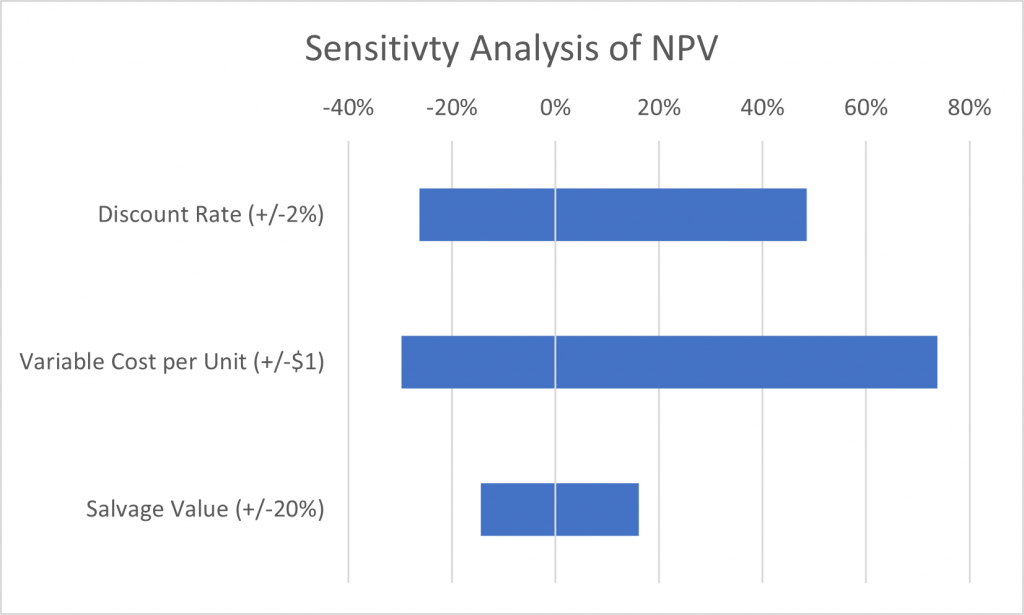
Additionally, we can similarly plot the sensitivity analysis for the variables using a tornado graph as shown in Figure 13.2. This type of graph shows the change in the NPV as a proportion of the best guess scenario.
Example 13.2
As mentioned in Chapter 10, it is also worthwhile considering whether it would be beneficial to communicate the results of a sensitivity analysis using tables. Returning to example 10.5, the information from the two-way sensitivity analysis would be most effective in a table due to the 9 possible combinations as shown in Figure 13.3 below.
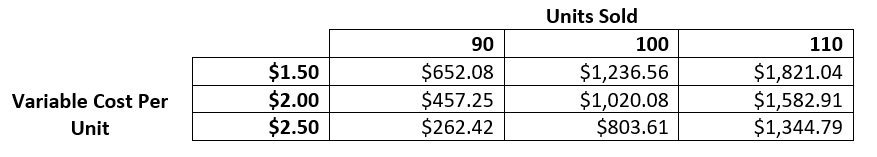
Tables can also be used for best-worse case scenario analysis and other partial sensitivity analysis.
Further Information and Real World Examples
For some example reports consider viewing the following links:
Example report on “Standing Council on Environment and Water” from PWC in 2011 which uses good practice for tables and figures PWC Report, 2011
Example report from Deloitte Access Economics titled “At what price? The economic, social and icon value of the Great Barrier Reef” which covers all important aspect of a CBA report including market and non-market aspects, and sensitivity analysis Deloitte 2017
For more information on different writing styles refer to the UQ assignment guide Assignment types – my.UQ – University of Queensland
Summary of Learning Objectives
- The goal of using reports for communicating analytical results is to communicate the information in a clear and precise manner to decision-makers and policymakers.
- A CBA report should cover all 9 steps of a cost-benefit analysis whilst following a general report structure. Using headings, tables and graphs helps communicate the results of the CBA more effectively.
- Specifically, you should identify whether similar projects resulted in the same conclusion and whether the assumptions are considered appropriate based on the relevant literature. ↵
