
Chapter 8: A Social Perspective to CBA
Learning Objectives
After completing this chapter, students should be able to:
-
Identify economic efficiency and its challenges in practical applications.
-
Understand the role of shadow prices for economic efficiency in CBA.
-
Identify and utilise relevant shadow prices using adjusted observed prices in distorted markets.
-
Demonstrate the difference between corrective and distortionary taxes/subsidies.
As we have seen in Chapter 5, the investor perspective CBA is fairly easy calculate. An analyst identifies the revenues and expenses to evaluate the opportunity cost to the investor.
The social perspective is harder to implement in CBA. Calculating social benefits and costs can be complex. Market prices often do not capture the social benefit and/or social costs associated with production or consumption of a good. Therefore, we need to consider:
1) Impacts on input and output markets (Chapter 6).
2) Shadow pricing using market prices or benefit transfers (Chapter 7 and 8).
3) The use of non-market valuation methods when a market does not exist (Chapter 12).[1]
This chapter focuses on how to attain a price for goods and services in markets that are distorted. In Chapter 6, we looked at how markets can be used to evaluate costs and benefits involved in an intervention or project through willingness-to-pay and opportunity cost. In Chapter 7, we discussed how to initiate the process of predicting and monetising impacts using the available literature and research (through benefit value transfers). However, we have yet to determine how to address market failures and market distortions associated with CBA projects under consideration.
Market failures are one of the most important aspects of social cost-benefit analysis. We know that market prices may not reflect the true value of an item, good, or service. Consequently, we may need to use shadow prices to capture the true value of the goods or services in question. This chapter focusses on shadow pricing using distorted markets and incorporating the result into the social perspective to cost-benefit analysis.
Returning to Efficiency
From the point of view of society, the requirement for economic efficiency is the marginal social benefit (MSB) is equal to the marginal social cost (MSC). In a perfectly competitive market, in the absence of distortions:
Demand = Marginal Social Benefit
Supply = Marginal Social Cost
Therefore, the efficiency condition holds as  . In this case, consumer and producer surplus is maximized. Consequently, total social surplus is maximized. It is allocative efficient and there is no potential Pareto improvement (see Figure 8.1). i.e., no individual can be made better off without making another party worse off.
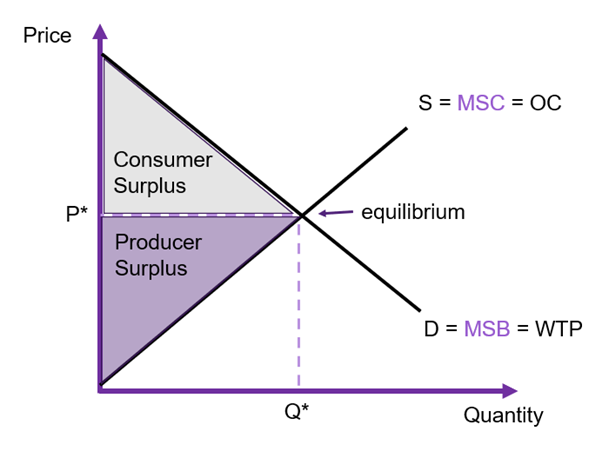
To understand allocative efficiency in the market we can consider the impact of inequality between marginal social benefit and marginal social cost. If  , it makes sense to allocate more resources as both the consumer and producer would gain additional surplus by doing so. The opposite is true when
  , it makes sense to allocate less resources to the market as the cost exceeds the benefit.
In the context of cost-benefit analysis, if the whole economy is perfectly competitive and all markets were subject to the invisible hand, private firms would undertake all projects where the net benefit is greater than zero. Hence, no unproductive project would ever be undertaken by an investor. This is because firms are profit maximisers. By maximising their own profits, the firms would also maximise all benefits to society. In this instance there would be no role for the government as an economic entity as all potential public sector projects would be undertaken by the private sector.
More specifically, from a societal perspective there would also be no need for social cost-benefit analysis as the economy would achieve allocative efficiency without assistance of a government. All social costs and social benefits would be accounted for in this perfectly competitive world. However, we know that no society or economy is perfectly competitive, and governments often intervene in markets for many reasons including but not limited to:
– correcting market failures
– improving the allocation of scarce resources
– improving the welfare of society
– redistributing welfare gains/ income
Key Concept – Competitive Markets
So why does economics focus on perfectly competitive markets? Especially when perfectly competitive markets are few and far between in the real world?
Economists use perfectly competitive markets as a benchmark for evaluation purposes. Having a benchmark allows for a point of comparison that we can compare observed results and outcomes against. Consequently, having a benchmark for CBA provides opportunities to identify potential Pareto improvements in the distribution of surpluses.
Efficiency and Shadow Prices
For the market to be efficient, there should be no externalities, no uncompetitive market structures, no information asymmetries, and no requirement for public supply of a good or service by a government. When one or more of these conditions exists, market failure exists and there is a misallocation of resources. Market failure implies the market price does not reflect the true value of the good or service – the marginal social benefit is not equal to the marginal social cost. In the instance that a market is inefficient, a CBA analyst needs to identify the appropriate price that reflects the true value of the item, good, or service. This is the shadow price for the evaluation of the policy under consideration.
If we do not use the appropriate shadow price, the results of the cost-benefit analysis may overestimate and underestimate the net social benefit (NSB). This is problematic as NSB is used to determine which projects we should undertake, leading to the potential for incorrect decisions. The goal of the social perspective CBA is to calculate the aggregate net social benefit to ensure the efficient allocation of resources – addressing the market failure. However, the distribution of the benefits and costs is not considered as part of this perspective. This is a consequence of the Kaldor-Hicks compensation criterion.
The Kaldor-Hicks compensation criterion was defined in Chapter 6 – when the net social benefit is greater than zero there is an ability to compensate losers with gains from winners through the transfer of benefits, resulting in a net gain to society. The Kaldor-Hicks criterion is the foundation for the net benefit criterion for decision-makers to only adopt policies with a positive net social benefit/net present value (Boardman et.al., 2001, 31). Compensation may not actually occur, but the ability for compensation provides a potential for Pareto improvement. Consequently, the Kaldor-Hicks criteria is a looser version of the potential Pareto improvement rule. To effectively capture the ability for potential compensation, all inputs to the CBA must represent the true value to society. Therefore, we often need to estimate shadow prices.
In this chapter, we discuss the evaluation and adjustment of market prices to establish the appropriate shadow prices. The shadow price can be found by adjusting the observed market values to ensure the willingness-to-pay (WTP) or opportunity cost (OC) reflects the value of the good or service. Specifically, we will look at shadow prices for input and output markets including those experiencing distortions via taxes, subsidies, government regulation, or market imperfections. When a market is distorted, there are two prices; (1) the price paid by buyers and (2) the price received by sellers. The goal is to determine which of these prices we should use in the cost-benefit analysis as the shadow price. Consideration for goods or services not traded on markets are covered in Chapter 12.
General Rules for Distorted Markets
At this point we highlight the general rules for shadow pricing in distorted markets. Firstly, we require identification of whether the intervention impacts an input or output market. Secondly, we need to identify what happens to the quantity traded: does the availability increase or is there a diversion of production/consumption on the market in question. Note that this often depends on the assumptions being made about the intervention.
General rules for input (costs) and output (benefits) markets are identified and outlined below.
Output markets
Output markets are those where the finished products are being purchased. In cost-benefit analysis, often output markets under consideration include monopoly producers, goods and services for consumption such as education or roads and transportation etc.
Rules:
– If the intervention causes the availability of the output to increase – use WTP
– If the intervention decreases the availability of the output for use by others to (diverting use) – use OC
Input markets
Input markets are also known as factor markets. These markets include those resources that the government, firms, or business need to purchase in order to produce goods or services for purchase (the output). Examples include land, labour, capital, and raw materials.
Rules:
– If the intervention causes the availability of the input to increases – OC
– If the intervention decreases availability of the input for use by others (diverting use) – WTP
Distorted Markets and Shadow Pricing Examples
We will now consider the competitive market as illustrated in Figure 8.1 in comparison to:
- Monopoly
- Distortive Taxes
- Distortive Subsidies
- Information Asymmetries
- Public Goods
- Externalities
- Corrective Taxes and Subsidies
- Monopsony
- Labour Markets with Minimum Wages
By evaluating the price paid by buyers and the price received by sellers we can identify which price is appropriate for use as a shadow price. We can then apply the appropriate shadow price to the Social CBA Perspective to ensure consistent estimation of the net social benefit. The examples provided are not exhaustive of market distortions we must account for, however the range of examples provided in this chapter allow for better understanding on how to apply the rules outlined above.
(1) Monopoly
A monopoly occurs when there is only one seller of a good or service on a market. A monopoly is a price setter in an output market. Like all firms, a monopoly chooses to price at the point of profit maximisation (MR = MC). However, in comparison to a perfectly competitive market the monopoly faces a downward sloping marginal revenue curve as monopolies are price makers.[2] When the market is a monopoly, the seller must lower the price to sell an additional unit, reducing the marginal revenue (the additional gain in revenue from selling one more unit). Consequently, the marginal revenue (MR) curve lies below the demand curve, and the firm will maximise its profits when marginal revenue is equal to marginal cost (MR = MC).
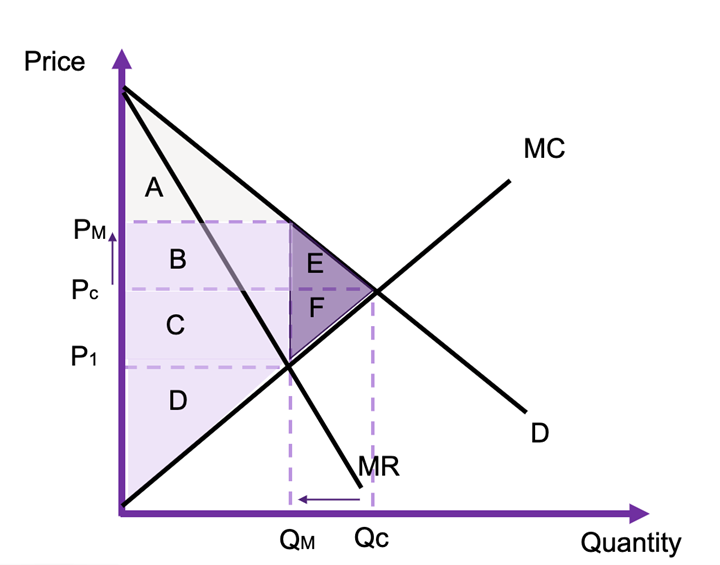
If the market is perfectly competitive, the equilibrium price and quantity would be  and
and  respectively as illustrated in Figure 8.2. Under the distorted monopoly market, the monopolist will choose to price at
  and quantity
  to maximise their profits. is the price received for producing units on the market and
  is the cost of producing this level of output. This increases the producer surplus and reduces the consumer surplus in the market. The monopoly also results in a deadweight loss the size of the purple triangles E and F. The rectangle B is a transfer from consumers to producers as part of the profit maximisation process of a monopoly.
From a cost-benefit analysis standpoint, determining which price to use for the evaluation of the impacts is much more challenging:
- If the government is purchasing the good from the monopoly output market, the government would be hijacking the consumption directly from private consumers. Therefore, the willingness-to-pay should be used to represent the true value of the intervention. Consequently, we would use as the shadow price. This is because resources would be taken away directly from other consumers in the market (diverted uses).
- If the government intervention increases the production of the monopoly output, the opportunity cost should be used as the shadow price. Hence the shadow price used for the intervention would be reflected by marginal cost curve (at point ).
- If the government intervention increases the production of a monopoly output is increased, but not by the full amount of the intervention, the shadow price should lie between the price and the marginal cost (price ). In previous chapters, we have suggested taking the average of the two prices.
(2) Distortionary Taxes
Taxes can be direct or indirect. Direct taxes are those imposed on income or profits. The person paying the tax is the one who carries the burden of the tax (for example, income tax is paid by those who receive income). In comparison, indirect taxes are imposed on goods and services. With indirect taxes, the incidence of tax is distributed between both the buyer and seller. The distribution of the burden depends on the relative elasticities. Examples of indirect taxes include GST, customs fees, duties etc. CBA often deals with indirect taxes in the evaluation of the market price of a good or services. There are two types of indirect taxes we deal with (1) fixed per unit taxes and (2) ad valorem taxes.
Fixed Per Unit Taxes (Specific Taxes)
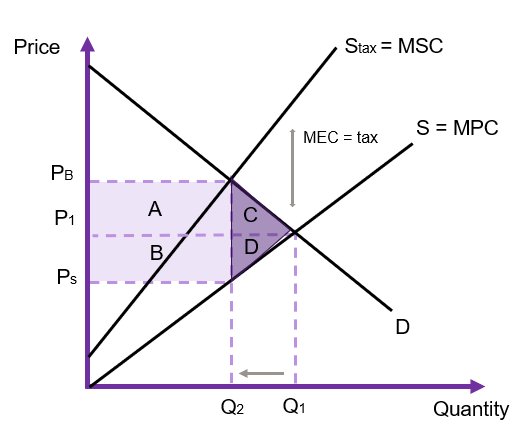
If the tax is a fixed amount per unit, it is a flat rate tax on each unit of output. If the tax is a fixed amount per unit, the change in the supply curve is a parallel shift as illustrated in Figure 8.3. The difference between  and
and  is the amount of the tax.
When the tax is distortionary, there are two prices – one paid by the buyer  and one received by the seller
  . We can also observe that regardless of the type of tax, the quantity traded on the market decreases due to the higher price faced by the buyer.
We can specify the linear function for the price paid by consumers as a function of the price received by the sellers and the tax rate as:
(1) 
where  is the per unit tax.
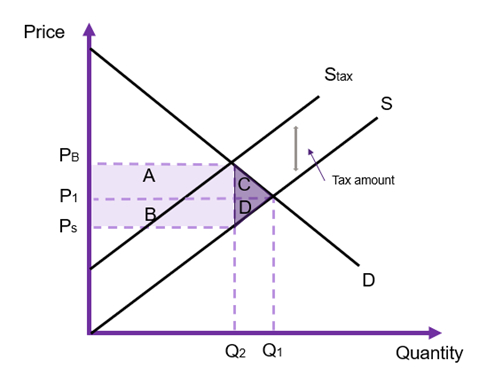
Figure 8.3 shows taxes drive a wedge between the price received by the buyer and the price paid by the seller, such that  . We also note that the equilibrium price increases from to , however the price received by the seller is which is below the initial equilibrium price. The tax is collected as a revenue stream for the government equal to the rectangle A + B which can be found by taking the difference between the buyer and seller prices and multiplying by the quantity traded after the tax is implement.
There is also a reduction in the producer surplus equal to the area of B and D, along with a reduction in the consumer surplus equal to A and C. Consequently, we can identify the triangles of C and D is a deadweight loss caused by the distortive tax (hence the distortion of a previously efficient market!). The area of A is the incidence of tax paid by the buyer and the area of B is the incidence of tax paid by the seller. These are not necessarily equal and depend on the relative elasticities of the demand and supply curves.
Example 8.1
Example: Calculating a Flat Tax
Assume that the market demand curve is linear and is expressed as:

And the supply curve is given by:

Solving for the market equilibrium before the imposition of a tax give an equilibrium price of $20 and an equilibrium quantity of 40 units.
If there is a tax of $2 per unit, we must shift the supply curve up to imply a $2 increase in the cost of production. Therefore, the new supply curve:

Equating the demand and the supply curve after the tax gives
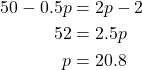
The new equilibrium quantity is therefore  units
units
From this information we can observe the following:
– The tax revenue received by the government is equal to 39.6 units  .
.
– The equilibrium price after tax has increased from $20 to $20.80. This means that the buyers’ price is 80 cents higher. Consequently, the buyer’s incidence of tax is 80 cents.
– The price the seller receives is is $18.80. Therefore, the seller pays $1.20 of the tax (found using the original supply curve).
– The burden of the tax falls on the seller.
You can try graphing the demand and supply curves to calculate the changes in the surpluses.
Ad Valorem Taxes
An ad valorem tax is a tax that is proportional to the price. In the case of an ad valorem tax, the change in the supply curve is not parallel to the original supply curve as illustrated in Figure 8.4.
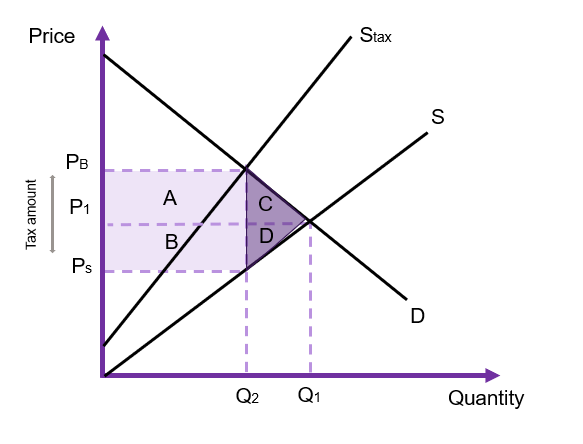
Again, if the tax is distortive, there are two prices – paid by buyers and received by sellers.
For an ad valorem tax, the relationship between the buyer and the seller prices is:
(2) 
where is the proportion of tax paid. As the amount of the tax is proportional to the number of units traded on the market, is no longer parallel to the original supply curve (seen in Figure 8.4). The impacts of the ad valorem tax on consumer and producer surplus are the same as under the flat (per unit) tax with A representing the burden to consumers and B representing the burden to producers. The deadweight loss is equal to the area of C and D combined.
How do we determine the appropriate shadow price when the tax is distortive?
The choice of shadow price to use in the CBA depends on the factors affecting the market. Again, we need to identify two key aspects:
1) Is the market affected by the tax an input or output market?
2) Does the availability increase or is there a diversion of production/consumption (production for inputs and consumption for output markets)
In relation to point 2) we look at whether the quantity traded is diverted from consumers in an output market or whether the use of the goods is diverted from their current use in an input market. If there is no diversion, the intervention is either satisfying the additional demand for an output or sourced from additional supply for an input.
Consequently, the conceptually correct shadow price to be used in the cost-benefit analysis could be or , depending on the circumstances.
Distortive tax in an Input Market.
- If the number of additional units of the input good are produced to meet the increased demand of the input for the project (i.e., supply is increased) – use (seller price) as it represents the opportunity cost of the additional production.
- If the currently produced units of the input good are diverted from their current use in the economy due to the project – use (buyer price) as it represents the WTP of the foregone benefit to the users of the input caused by the diverted use.
Distortive tax in an Output Market.
- If the intervention causes an increase in the availability of the good, that satisfies additional demand on the market – use as it represents the WTP for the additional output (the benefit to the buyer).
- If the intervention diverts consumption of the output for use by others – use as this represents the opportunity cost of the consumption of the output foregone.
In practice, when dealing with distortive taxes and its applications inCBA we often use for input markets (representing the opportunity cost of production) and for output markets (representing the willingness-to-pay). For practical applications, it is also important to take into account the marginal excess tax burden. The marginal excess tax burden (METB) measures of the additional loss to society from raising an additional dollar of revenue through the tax, beyond the revenue collected. It represents the deadweight loss associated with the tax. Calculating the METB is complex, involving modelling the behaviour of individuals and firms under different tax scenarios and comparing the resulting economic outcomes to determine the additional loss to society associated with the tax.
(3) Distortionary Subsidies
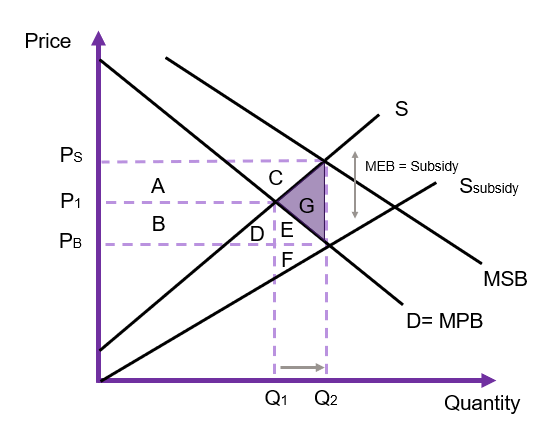
Similar to the situation with taxes, we can consider how to correct for market distortions when government subsidies exist on the market. The aim of a subsidy is to lower the price of the good or service for buyers. After applying the subsidy to the market, the price paid by consumers will be less than the initial equilibrium as shown in Figure 8.5. The supply to customers is represented by  which captures the cost of production minus the subsidy paid by the government. Again, there are two prices: one paid by the buyer and the price received by the seller and under a subsidy
  . Similar to taxes, the relationship between the price paid by buyers and the price received by the seller can be summarised as
  for a fixed subsidy and
  for an ad valorem subsidy. It is important to note that is lower than the initial equilibrium price of and is higher than the initial equilibrium price . The subsidy also increases the quantity of the good traded on the market from
  to
to  .
.
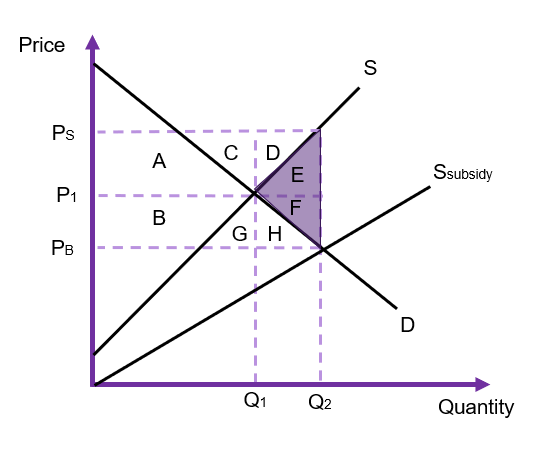
From the implementation of the subsidy, we can see that the consumer surplus increases by the area of B, G and H, due to the reduced price. Producers gain additional revenue in the output from the subsidy equal to A, C and D as the producer now receives a higher price for the good. The increased benefits to consumers and producers are at a cost to the government who has an expenditure equal to the area of A + B + C+ D + E + F + G + H. As the quantity of the good on the market has increase and we no longer produce at the socially optimal level, there is a deadweight loss to society of the area of E+F. Again, the relative benefits to producers and consumers of the subsidy depend on the relative elasticities of the supply and demand curves.
How do we determine the appropriate shadow price when the subsidy is distortive?
The choice of conceptually correct shadow price to reflect the value of the good or service under consideration in the CBA will depend on whether (1) it is an input or output market and (2) whether production/consumption is being diverted from the market. Based on this, the shadow price can be or for the subsidy depending on the market under consideration.
Distortive subsidy in an Input Market.
- If the production (supply) on the market increases to meet the additional demand of the input for the project – use (seller price – without the subsidy) as it represents the opportunity cost of the additional production.
- If the availability of the input on the market is consequently diverted from their current use in the economy due to the project – use (buyer price – with the subsidy) as it represents the WTP of the foregone benefit caused by the diverted use. It also represents the price actually paid by the buyers in the market.
Distortive subsidy in an Output Market.
- If the intervention causes an increase in the availability of the good, that satisfies additional demand on the market – use as it represents the WTP for the additional output. This price represents the price actually paid by buyers.
- If the intervention diverts consumption of the output for use by others – use as this represents the opportunity cost of the consumption of the output foregone.
In practice, when dealing with distortive subsidies in CBA we often use for input markets (representing the opportunity cost of production) and for output markets (representing the willingness-to-pay) – remembering that the seller price is greater than the buyer price when there is a subsidy on the market ( ). Furthermore, it is important to note that with subsidies on input markets, there may be flow on effects to output markets. For example, if we consider the effect of a subsidy on fertiliser (an input) and how it affects the output of wheat produced by Australian farmers. The subsidy will impact both the fertiliser and wheat markets. As the government implements a subsidy for fertiliser this will reduce the marginal cost of production for the firm producing wheat. The shadow price for fertiliser would need to be identified based on the market conditions and consequently the changes in consumer and producer surplus on the wheat market would need to be identified to fully capture the impacts of the policy.
(4) Information Asymmetry
Information asymmetry is caused by an imbalance in the information between a buyer and a seller, causing one agent in the market to be better informed. Figure 8.6 illustrates the impact of information asymmetry on the market from the perspective of the buyer. When there is information withheld from the buyer the demand curve faced by the buyer would be  – this occurs when the seller has more information on the quality of the good or service than the buyer has. This results in a market distortion where the market clears with consumers paying a higher price and purchase more of the good, above the socially optimal level of output. Obviously, if the buyers are fully informed their willingness-to-pay would be lower. This would result in symmetric information and the demand curve would be
  and the market would be efficient. Comparing the situations, if the market faces there is over production of the good or service as the marginal social benefit is not equal to the marginal social cost which implies the market is inefficient. This creates a deadweight loss of the area B. Additionally, as the market clearing price is
  , there is also an increase in the producer surplus equal to the shaded area of A.
Due to the aforementioned impacts, using the market prices under asymmetric information is likely to value inputs or outputs inaccurately in a cost-benefit analysis.
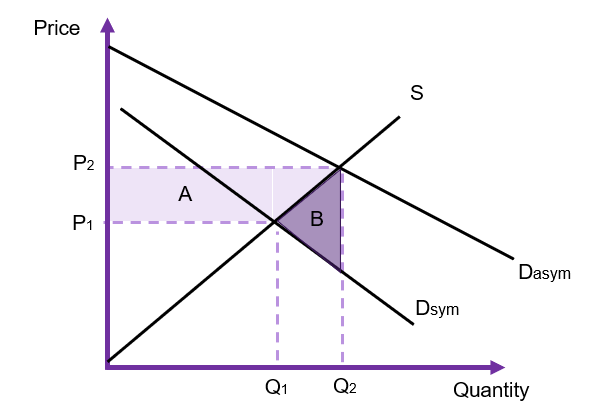
For the context of CBA, the choice of which price to use as the shadow price depends on the type of information asymmetry and whether the buyer or the seller is the uninformed party, and the type of asymmetric information.
There are many types of information asymmetry in output markets. The three main types often discussed by economists include: (1) search goods, (2) experience goods, and (3) credence goods.
A search good is tangible and measurable (e.g., clothing, furniture). It can be assumed that the buyer of a search good can seek out and verify the required information required before purchase resulting in the market achieving the socially optimal outcome. In this case there is no need for government intervention and the market price will correctly be evaluated at . In this instance, the distortion should resolve itself and the market price can be used to value the good or service.
For experience goods (e.g., movies, haircuts), information regarding the quality cannot be ascertained before consumption due to subjectivity and the intangible nature of the goods. However, there can often be information shared and searched for after the fact. For example, word of mouth or reviews posted on the internet can be utilised by individuals to reduce the deadweight loss associated with this form of information asymmetry. Lastly, credence goods (e.g., education, healthcare, and other professional services) are intangible and consumers cannot fully observe the outcome relating to the good, even after purchase. This is the more problematic format of asymmetric information, and the determination of the appropriate shadow price is more complex.
Information Asymmetry and Shadow Prices
Depending on the type of asymmetric information will determine the shadow price used. Often the opportunity cost of search time to reduce information asymmetry and the reduced price from being informed on the transaction gives a net benefit to the consumer of the good that can be calculated (see for example this paper by Scott, Scott and Auld from 2005 on the benefits of internet searches). Given the complexity of asymmetric information, it is often suggested that government intervention is the preferred method for resolving the distorted market. If a government can intervene, regulate, or provide information for less than the deadweight loss, then net benefits would be positive. If there is an intervention to resolve the incomplete information provided to one party, the price should be equal to the equilibrium price when the demand for the output (or supply curve for input) is represented by (for example, this would be at price in Figure 8.6). In CBA, if the government intervenes and provides the uninformed party with the required information it can reduce the deadweight loss. For example, in a second-hand car market the government can require roadworthy certificates which would reduce information asymmetries and therefore decrease the loss to society. Therefore, if the cost of intervention is less than the benefit from the reduced deadweight loss, the project or policy should be undertaken.
Finally, it is worth mentioning at this stage that asymmetric information in input markets is also possible. An example of this is through the labour market where the quality of a worker (the supplier of labour) is unknown to the buyer of labour (the firm). Similar issues arise from asymmetric information in input markets, but one important concept is the costing of interviews and hiring when evaluating a labour (input) market experiencing asymmetric information.
Case Study: Volkswagen Emissions Scandal (Diesel-Gate)
Many companies withhold information from the market often engaging in low-risk, high return “moral hazard” behaviours. This is a particularly common issue in economics with many examples relating to car manufacturers.
In 2015, Volkswagen (VW) admitted to installing devices to cheat diesel emissions test. Consumers were led to believe that their cars were more environmentally friendly due to reduced carbon emissions. The VW diesel cars were subsequently marketed as one of the most fuel efficient, reduced emission cars on the market at the time. This “greenwashing” resulted in consumers purchasing cars that were “believed to be better for the environment”. As a result, more VW diesel cars were likely bought and sold at a higher price than socially optimal. This increase VW’s producer surplus and create a deadweight loss to society.

(5) Public Goods
Pure public goods have two key attributes: (1) non-excludable, and (2) non-rivalrous. Non-excludable means it is not possible to exclude someone from the use of the good. Non-rivalrous means the consumption of the good by one person does not diminish the ability of another person to consume the good at the same time. Examples of public goods are national defence, law enforcement, air, and street lighting.
Due to the key characteristics of a public good, there is no incentive for the private sector to produce the good or service. Additionally, public goods are subject to the free rider problem as consumers can utilise or consume public goods without paying for them. To determine the marginal social benefit of a public good, the individual demand curves are added vertically, as illustrated in Figure 8.8. This is because a public good is non-excludable, so the marginal benefit is equal to the sum of the individual marginal benefits (i.e., the willingness-to-pay of each person in the market). The resulting curve is known as the kinked demand curve. If  is the demand for individual 1 and
  is the demand for individual 2, we add the two demand curves vertically together with the intercept equal to the sum of the individual intercepts. This creates a kink in the MSB curve at the quantity where intersects the demand curve.
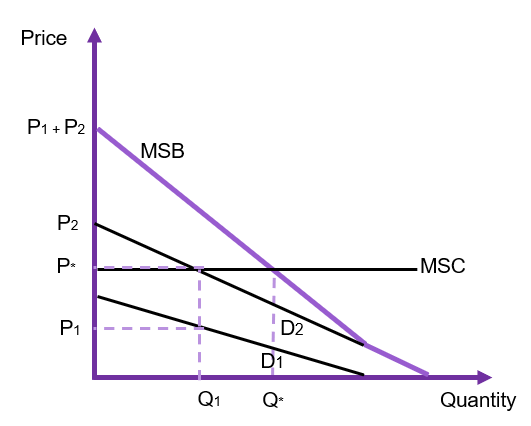
If we assume a constant marginal social cost, and an equilibrium price of  the efficient market equilibrium would be at
  . However, as this is a public good the quantity actually produced is units at price . This is the underproduction caused by the provision of a public good.
Public goods are complex by nature, and for practical purposes it is not known exactly what the market for a public goods is like. Shadow prices for public goods will be discussed in detail in Chapter 12, as in most cases there are no markets for “pure” public goods and therefore we cannot evaluate it from the perspective of market distortions. We can however derive the willingness-to-pay using non-market valuation methods.
(6) Externalities
An externality is an indirect cost or benefit that impacts a third party not involved in the consumption or production of the good or service. Externalities can be positive (additional benefit) or negative (additional costs). Consumers will purchase the good or service where the marginal private cost (MPC) is equal to the marginal private benefit (MPB). In the case of an externality, there is an additional impact that provides a benefit or cost to society.
A negative externality imposes an additional cost to society from the production. This could be in the form of pollution, traffic congestion, noise, etc. Negative externalities result in a marginal social cost that is higher than the marginal private cost, resulting in a negative consequence to society. In the instance the externality is positive, the price of the good on the market does not capture the additional benefits the good or service provides to society. However, there is a positive spill-over effect benefitting society.
The result of an externality is that the market underestimates the social costs or underestimates the social benefits of the good or service under consideration as part of the CBA.
Negative Externality
In the instance the externality is negative, the price of the good only reflects the marginal private cost of production. There is an additional cost imposed on society known as the marginal external cost (MEC). Consequently, the marginal social cost is equal to the marginal private cost plus the marginal external cost ( ). The impact of a negative externality is illustrated in Figure 8.9 below.
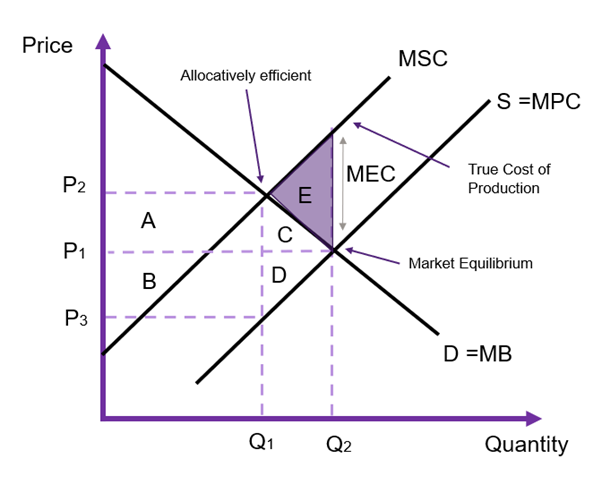
A negative externality causes a deadweight loss to society caused by the overproduction of the good and service as the marginal social cost exceeds the marginal benefit at the market equilibrium (MSC > MB at quantity ).
Similarly, with a positive externality there is underproduction as the marginal social benefit exceed the marginal cost at the market equilibrium. In this instance marginal social benefit is equal to the marginal private benefit plus the marginal external benefit ( ).
).
Shadow Prices and Externalities
As externalities are a prevalent issue in CBA it is crucial that the appropriate shadow price is used in the analysis to ensure the net social benefit reflects the project accurately. Usually, the shadow price is captured as an external benefit or cost component in the CBA rather than a change in the market price used in the evaluation of the project i.e., we may calculate the marginal external cost or benefit directly. However, if we can observe the marginal external cost directly in the market, we can use the shadow price that reflects the true value of the good or service. Specifically:
- For a negative externality, the shadow price that should be used is the price that captures the true value of the good or service. In this instance it would be the point where
 at the point of allocative efficiency (price in Figure 8.9).
 - For a positive externality, the shadow price that should be used is the price that captures the true value of the good or service. In this instance it would be the point where
 at the point of allocative efficiency.
Questions can arise on whether we can exactly determine the amount of the marginal external cost to be used as a shadow price. When an externality is more complex, it is possible to consider non-market valuation methods as outlined in Chapter 12.
Case Study Example: Bee Keeping

Bee keeping is a positive externality. Beekeepers raise colonies of bees to harvest their honey and sell it to the public. However, bees are crucial in plant pollination processes. By keeping and harvesting honey, the beekeepers have spill over benefits to those who grow fruits, vegetables, and flowers for a living. Without these bees, farmers would have to manually pollinate their crops. Consequently, by encouraging bee farming improves agricultural and horticultural crops.
In 2021, Business Queensland estimated that harvesting honey contributes a total of $129 million to the Australian economy each year (Queensland Government, 2021). However, governments around the world have been aware of the progressive disappearance of bees and are attempting to implement policies to educate and support those who wish keep bees and correct the market failure.
(7) Corrective Taxes and Subsidies
Governments often levy taxes to resolve negative externalities and provide subsidies to resolve positive externalities. In these cases, we can consider the impact on the price used in the cost-benefit analysis. In the instance where the government intervenes in the market to correct an externality, we consider it a corrective tax or subsidy. A corrective tax is also known as a Pigouvian tax, implemented to correct the market failure, discouraging the activity as under a negative externality. Due to the negative externality, production is too high – exceeding what the socially optimum outcome would be. A Pigovian tax is a targeted corrective tax implemented to increase the cost of production and encouraging producers to provide less output to the market. This type of corrective tax exists to “internalise” the externality such that marginal social benefit is equal to marginal social cost ( ). If a corrective tax is set at the efficient level, the amount of the tax would be equal to the marginal external cost (
 ).
).
Some common examples of corrective taxes include alcohol, fuel, and tobacco. Corrective taxes are considered welfare improving as the tax directly corrects the consumption decision though higher prices, correcting the over consumption. In these examples, the taxes are being used to address clear externalities in the form of incurred costs on other such as alcohol related violence, pollution, and healthcare respectively. In addition to this, corrective taxes generate benefits to the government in the form of revenues.
The same general rules hold for corrective taxes and subsidies. Explanations are provided below for your convenience.
Corrective Tax in an Input Market (use ).
- If the corrective tax results in additional units of the input produced for use, that is from additional supply, use – as this is the gross cost of the use of the input which represents the opportunity cost of production. This means you are pricing at the marginal external cost plus the buyer WTP.
- If the corrective tax results in the input of the good to be diverted from their current use in the economy, use – as it represents the WTP of the foregone benefit to the users of the input caused by the diverted use.
Corrective Tax in an Output Market (use ).
- If a corrective tax increases the availability of the good on the market use – which represents the net benefit per unit supplied after the external cost is accounted for. Specifically, the buyer is demanding the good in this market at price , we then subtract the external cost, which is equivalent to the tax, leaving as the appropriate price.
- If a corrective tax diverts consumption of the output for use by others, use – as the total external cost does not change because the quantity consumed does not change as a result of the tax.
Corrective Subsidy in an Input Market (use ).
- If the corrective subsidy results in additional units of the input produced for use, that is from additional supply, use – as this is the gross cost of the use of the input which represents the opportunity cost of production. This means you are pricing at the marginal external benefit plus the sellers OC.
- If the corrective subsidy results in the input of the good to be diverted from their current use in the economy, use – as it represents the opportunity cost of the foregone benefit to the producers of the input caused by the diverted use.
Corrective Subsidy in an Output Market (use ).
- If a corrective subsidy increases the availability of the good on the market use – which represents the net benefit per unit supplied after the external benefit is accounted for. Specifically, the buyer is demanding the good in this market at price , we then subtract the external benefit, which is equivalent to the subsidy, leaving as the appropriate price.
- If a corrective subsidy diverts consumption of the output for use by others, use – as the total external benefit does not change because the quantity consumed does not change as a result of the subsidy.
Case Study: Corrective Taxes on Soft Drinks

Governments use taxes to correct negative externalities. The use of the tax is to internalise the external cost by increasing the cost and discouraging overconsumption. One of the most recent uses of corrective taxes relates to taxes on sugary drinks. Governments around the world have adopted such taxes to correct the health consequences from overconsumption of these drinks. Lal et al., (2017) estimated that an introduction of a 20% tax on these types of beverages would reduce healthcare costs by almost $2 billion dollars through the prevention of dental health issues, diabetes, and heart disease. The collection of tax revenues governments can collects associated with these types of interventions could subsequently be spent on healthcare interventions and other important public programs. From a CBA perspective, corrective taxes usually improve social welfare and should be undertaken.
(8) Monopsony
We can think of a monopsony as a monopoly power in an input market. Explicitly, a monopsony occurs when there is only one buyer of a resource in an input market. Consequently, monopsonies are price setters in an input market. Monopsony power is likely to occur in labour markets, particularly when there is a small town where there is only one employer or for electricity generation markets. In this instance, as the buyer of the input the monopsony maximises their profit by restricting the amount of the factor of production the firm purchases. Therefore, the monopsony firm faces a marginal factor cost (MFC) curve which lies above the supply curve and is equal to the marginal expenditure (ME) on the input. The supply curve also represents the average cost of each unit of the input used. Additionally, there is no demand curve in a monopsony. Instead, the monopsonist faces a marginal revenue of product (MRP) curve (under the labour market example this is often referred to as the value of marginal product, VMP).
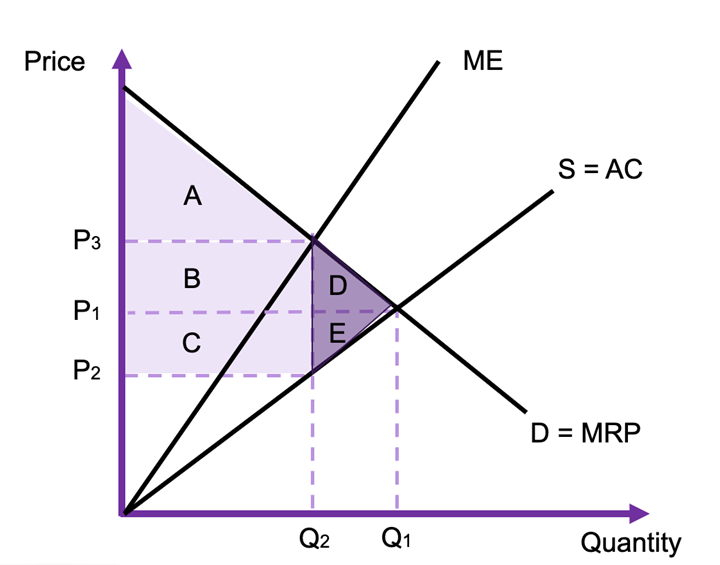
The monopsonist would purchase where the marginal revenue of product is equal to the marginal factor cost (MRP= MFC(ME) ). Consequently, the result in the market is a price below the competitive equilibrium (price in Figure 8.14). This creates a deadweight loss to society of the purple triangle D and E, and there is a transfer of rectangle C from the producers (e.g., the sellers of labour) to the monopsonist (e.g., the buyer of the labour).
From a cost-benefit analysis standpoint, we identify the following potential shadow prices for a monopsony:
- If intervention diverts the input from use by the monopsonist, the value to the monopsonist should be used as the shadow price. Specifically, the value of the resource to the monopsonist is
 which is above the current market price and price actually paid (). is the value to the firm purchasing the labour input and represents the opportunity cost of the workers in the market.
 - If the intervention increases the available resource for production, the opportunity cost represented by should be used as the shadow price. This represents the price the monopsonist is willing to purchase the input.
- If the intervention only somewhat increases the availability of the resource, but not by the full amount, the shadow price should lie between the price and the marginal cost (price ).
(9) Labour Market with Minimum Wage
One of the unique inputs for a policy or project that often experiences a distorted market is the labour market. When evaluating the appropriate price to use in the CBA we need to consider the labour input. An analyst must identify whether the policy or project decreases the available use of labour by others participating in the market or if the labour can be sources from elsewhere (such as hiring unemployed workers). The results of the evaluation of distorted labour markets is subsequently easier to understand in comparison to the impacts of taxes and subsidies.
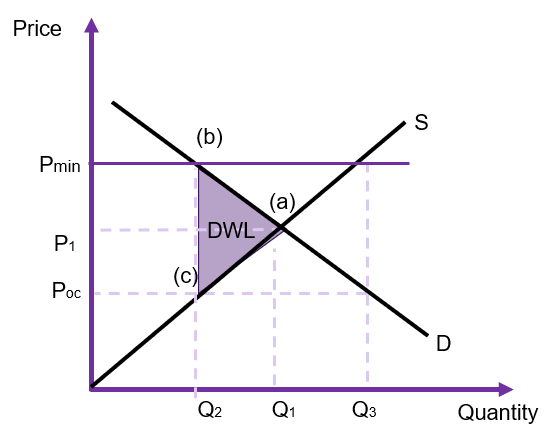
- If the labour utilised is diverted from their existing uses elsewhere in the economy decreasing the availability, we should utilise the willingness-to-pay for that labour which is given by the price received by those workers already participating in the market. If we assume the market is affected by a minimum wage, this price would be at
 in Figure 8.15.
 - If the labour can be hired from unemployed workers, these workers should be priced at the opportunity cost of their labour which would be
 in Figure 8.15 as these workers would have otherwise not been employed.
It is important to note that sometimes we do not correctly account for the opportunity cost in some applications of CBA. For example, when governments value the time of jurors to provide compensation, often the full opportunity cost is not captured. Jurors receive the value of their market wage, and are compensated for travel and meals. However, there is no compensation for their lost time, leisure, and the absence from family. This is an area for potential improvements to be made in CBA to capture the true value of judicial proceedings.
Conclusion
To round off the discussion of distorted markets it is important to note that there are other forms of market distortions including tariffs, quotas, price supports, etc., that can create difficulties in determining the appropriate shadow price to use to reflect the true value of the good or service on the market. We do not discuss these here but we provide the table below to assist in the process:
Revision
Summary of Learning Objectives
- We use the allocative efficiency of a competitive market as a benchmark for comparison. This allows us to identify potential Pareto improvements.
- Shadow prices are required when the market price does not reflect the true value of the item, good, or service being evaluated as part of the CBA. We must use a shadow price to capture the true social benefit or social cost of an output or input. If we do not use a shadow price, we may overestimate or underestimate the net social benefit.
- This chapter looked at how to shadow price across 9 potential market distortions including monopolies, distortive taxes and subsidies, information asymmetries, public goods, externalities, monopsony, minimum wages and corrective taxes and subsidies.
- The selection of the appropriate shadow price depends on whether a tax is distortive or corrective.
References
Queensland Government Business Queensland (2021), Beekeeping in Queensland. Retrieved from https://www.business.qld.gov.au/industries/farms-fishing-forestry/agriculture/niche-industries/beekeeping
Lal A, Mantilla-Herrera AM, Veerman L, Backholer K, Sacks G, Moodie M, et al. (2017) Modelled health benefits of a sugar-sweetened beverage tax across different socioeconomic groups in Australia: A cost-effectiveness and equity analysis. PLoS Med 14(6): e1002326. https://doi.org/10.1371/journal.pmed.1002326