
36 DATA-DRIVEN MARKET SEGMENTATION ANALYSIS – Contributions by Sara Dolnicar
For 20 years, since the beginning of my PhD under the supervision of the legendary Josef Mazanec (Dolnicar, 2014) at the Vienna University of Economics and Business, I have studied market segmentation methodology. I was often asked why I was so interested in market segmentation methodology and why I felt my work mattered. It matters because market segmentation analysis – and the data analytic methods used in market segmentation analysis – are heavily relied upon by tourism industry to gain market insights and by academic tourism researchers to develop theoretical knowledge (Dolnicar, 2004). A review by Zins (2008) suggests that about five percent of academic articles published in tourism utilise market segmentation in some way (e.g., most recently Mauri & Nava, 2021; and the role of segmentation in choice modelling, Kemperman, 2021). When broadening the review scope to methods of data analysis (rather than merely the creation of market segments as the outcome of the study) this proportion increases further: ten percent of studies published in tourism journals use cluster analysis (Mazanec, Ring, Stangl & Teichmann 2010). Uptake of market segmentation in industry is also high, with most national and tourism organisations specifying the target segments they focus their efforts on.
Because of the wide uptake of market segmentation in tourism industry and academia, any weakness in market segmentation methodology translates directly into a suboptimal market segmentation solution used as the basis for marketing action by the tourism industry or incorrect conclusions by academic researchers using segmentation methods to push the boundaries of theoretical knowledge. Preventing incorrect conclusions motivated my colleagues – most notably Bettina Grün and Friedrich Leisch – and I to work on improving market segmentation methods for two decades, culminating ultimately in our book titled “Market Segmentation Analysis: Understanding It, Doing It, and Making It Useful” (Dolnicar, Grün & Leisch, 2018; freely accessible at https://link.springer.com/book/10.1007/978-981-10-8818-6) and the free Massive Open Online Course (MOOC) on market segmentation analysis accompanying the book (https://www.edx.org/course/market-segmentation).
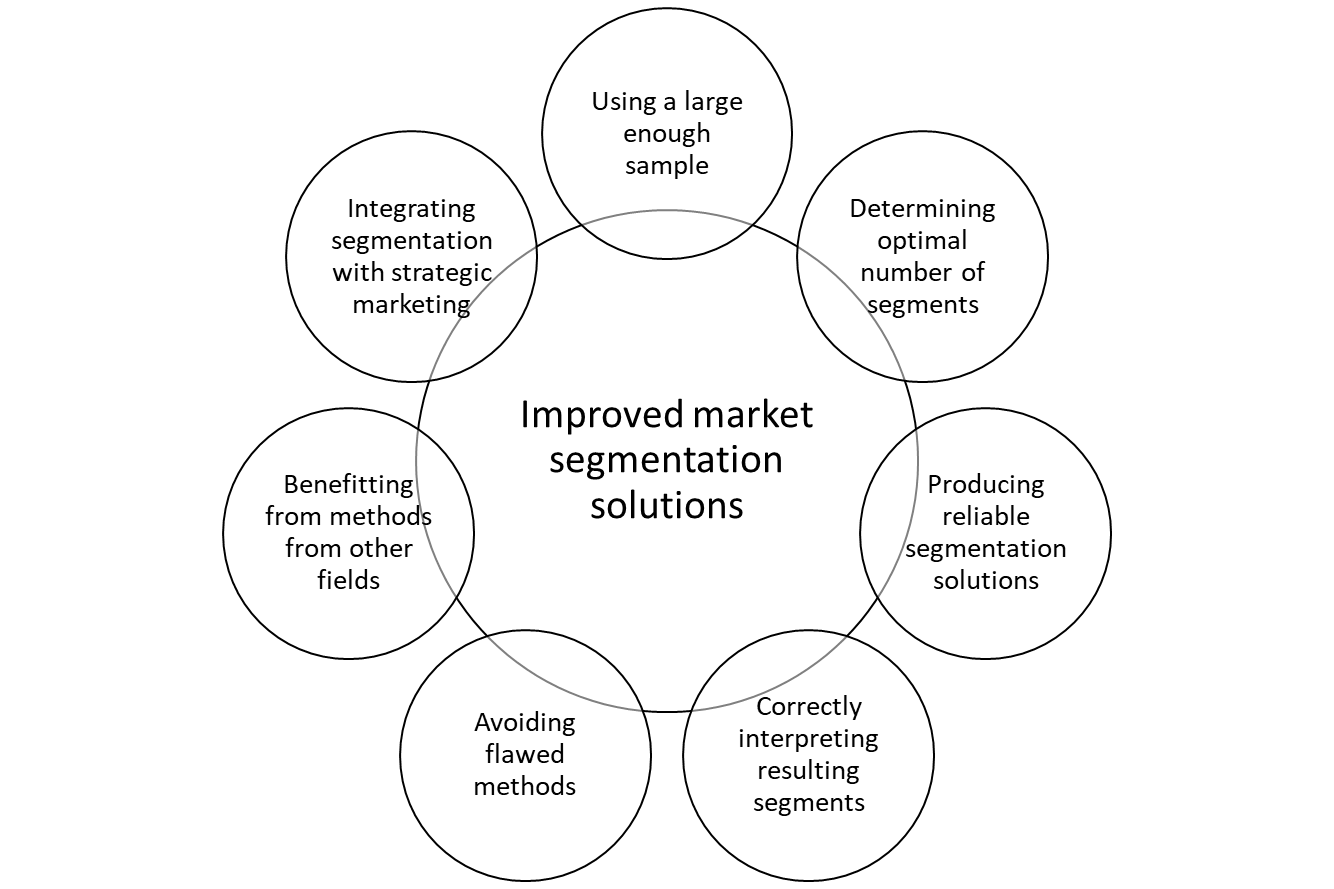
What do we view as our most important contributions?
Offering the first sample-size recommendation
Running a posteriori (Mazanec, 2000), post-hoc (Myers & Tauber, 1977) or data-driven (Dolnicar, 2004) segmentation studies with a large number of segmentation variables (such as 30 vacation activities or 25 benefits sought) but only a small sample size leads – unbeknownst to the user of the segmentation solution – to random segments that are meaningless at best and dangerous at worst. Because a sample size recommendation was historically not available, many segmentation studies in tourism and beyond worked with too small samples but were unaware of the consequences because they only calculated one segmentation solution. Having a sample size recommendation available improves the quality of market segmentation studies because it helps data analysts avoid random solutions.
We developed the first such recommendation (Dolnicar, Grün, Leisch & Schmidt, 2014) from simulation studies with artificial data of known structure. The recommendation is relative to the number of segmentation variables: for each segmentation variable (e.g., each vacation activity, or benefit sought) used in the analysis, a minimum of 70 data points (e.g., survey respondents) are necessary. In a second simulation study we pushed the boundaries of sample size requirements by simulating empirical data sets containing specific features, such as correlated segmentation variables, that complicated the task of correctly identifying existing market segments in the data (Dolnicar, Grün & Leisch, 2016). The result was an updated sample size recommendation of 100 data points per segmentation variable used. If a data-driven segmentation analysis uses 20 segmentation variables, the minimum sample requirement is 2000. Complying with this sample size recommendation protects data analysts from random solutions for structured data sets and alerts them to random solutions for unstructured data sets.
Approaches to determine the optimal number of market segments
One of the key decisions a data analyst makes when running data-driven market segmentation analysis is to select how many market segments to generate. This is a major decision because it determines the nature of the resulting segments. We identified optimal statistical criteria for the selection of the number of clusters in binary data sets (Dimitriadou, Dolnicar & Weingessel, 2002). We later realised, however, that the best criterion for selecting the number of segments to extract is the stability of the segmentation solution: if the calculation is repeated, do the same segments emerge? The issue of making segmentation solutions more reliable (see next section) and selecting the optimal number of clusters, therefore, are intrinsically linked issues that can only be addressed synchronously.
Approaches to making market segmentation solutions more reliable
We developed a technique that uses the stability of results from repeated calculations of segmentation analysis using bootstrap samples to determine: (1) whether data contain naturally occurring market segments, structure other than segment structure, or no structure at all; and (2) how many segments should be extracted from data (Dolnicar & Leisch, 2010, 2017). Critically, we showed that different data structures require different conceptual approaches to market segmentation. In the case of segment structure, the segmentation task involves revealing naturally existing clusters (natural segmentation). If the data are structured but contain no segments, the structure can still be leveraged to arrive at relatively stable segmentation solutions across repetitions, permitting reproducible segmentation. If the data are unstructured entirely, the only option is constructive segmentation: data analyst and user must jointly select one of many artificially created segmentation solutions.
In practice, this re-conceptualisation of market segmentation has profound implications: with natural segments rarely present in consumer data, segmentation solutions cannot be derived solely from statistical analysis, but rather require substantial user input. This is critical in the common case of constructive segmentation, where data analyst and manager must select one of many thousand legitimate consumer groupings as the basis for their segmentation strategy. Using the technique we developed, data analysts can determine the correct approach to market segmentation – natural, reproducible, or constructive – for their data. The analysis of stability of market segmentation can be conducted at the segment solution level (Dolnicar & Leisch, 2010) or at the segment level (Dolnicar & Leisch, 2017).
The significance of this piece of work lies in the fact that it is the first conceptual framework that acknowledges that natural clusters rarely exist in empirical consumer data, suggests a typology of segmentation approaches and offers an analytic tool that helps data analysts to determine which of those types of approaches are available to them given the structure of their empirical data.
Improving interpretation of market segmentation solutions
Results from data-driven market segmentation analyses are typically presented in large tables with interpretation requiring pairwise comparison of hundreds of numbers. For this reason, managers and practitioners generally struggle to interpret them. We developed a suite of graphical statistics methods that allow managers to efficiently compare market segmentation solutions, grasp key features of each segment, and assess segment distinctiveness (Dolnicar & Leisch, 2013). Our eye-tracking research (Babakhani, Leisch & Dolnicar, 2019) demonstrates that these new graphical visualisations significantly reduce the cognitive effort required to interpret segmentation solutions and increase correctness of interpretations. High-quality graphical statistics will, in the future, enable market segmentation analysis of continuous streams of data generated in real time.
Raising concerns about commonly used segmentation algorithms in tourism research
An approach commonly used in tourism segmentation studies is factor cluster analysis. In factor cluster analysis, raw data is first factor analysed and resulting factors are used as input for cluster analysis. Despite conceptual concerns having been raised about the suboptimality of factor-cluster analysis (Sheppard, 1996), factor cluster analysis was – and sadly still is – routinely used in tourism research. In an extensive simulation study with artificial data sets mirroring typical tourism data sets, we proved that factor analysing items before constructing segments usually leads to inferior results compared to using raw data directly, and never outperforms analyses using raw data (Dolnicar & Grün 2008). Even in cases where the artificial data is generated using a factor model (giving factor cluster analysis a huge advantage), factor cluster analysis fails to outperform clustering raw data directly.
Introducing analytic technique from other fields of research
Over the years, we have tested a range of analytical approaches used in other fields to assess whether they offer improvements over commonly used algorithms in tourism. Most notably, we introduced two neural network methods to segmentation analysis.
Bagged clustering (Dolnicar & Leisch, 2000; 2003; 2004) is an ensemble method which first runs many repeated cluster analyses using a partitioning algorithm (able to handle large sample sizes), then it discards the original data and calculates a hierarchical cluster analysis with the centroid resulting from the first set of calculations. This process substantially increases the stability of results, thus improving the reliability of segmentation solutions and their credibility as a basis for developing marketing plans in organisations.
Biclustering (Dolnicar, Kaiser, Lazarevski & Leisch, 2012) simultaneously groups individuals and selects variables without discarding the variables before or during the analysis. This elegant approach, previously used only in the analysis of genetic data, enables marketing researchers to run segmentation analysis without having to decide in advance which items to include in the analysis. In so doing, two mistakes are avoided: the exclusion of relevant variables before segmentation analysis and the overestimation of included variables which in fact contribute very little to the segmentation solution.
Integrating market segmentation with other strategic marketing instruments
Market segmentation goes hand in hand with the positioning of an organisation and its competitive situation. To find an optimal overall marketing strategy, these three aspects need to be analysed simultaneously. Yet the standard approach in marketing planning is sequential, precluding identification of a global optimum. I contributed to the development of perceptions-based market segmentation, a non-parametric simultaneous analysis of segmentation, positioning and competition which prevents sequence errors (Dolnicar, Grabler & Mazanec 1999; Buchta, Mazanec & Strasser 2000; Buchta, Dolnicar & Reutterer 2000).
Acknowledgements
I am deeply grateful for the support of the Australian Research Council (DP110101347, LX0881890, LX0559628). Without this support it would have been impossible for my colleagues and I to make the contributions discussed in this chapter.
Written by Sara Dolnicar, University of Queensland, Australia
Read Sara’s letter to future generations of tourism researchers
References
Babakhani, N., Leisch, F., & Dolnicar, S. (2019). A good graph is worth a thousand numbers. Annals of Tourism Research, 76, 338-342.
Buchta, C., Dolnicar, S., & Reutterer, T. (2000). A nonparametric approach to perceptions-based market segmentation: applications. Series: Interdisciplinary Studies in Economics and Management, Volume II. Springer, Berlin.
Dolnicar, S (2004). Beyond “commonsense segmentation” – a systematics of segmentation approaches in tourism. Journal of Travel Research, 42(3), 244-250.
Dolnicar, S., & Grün, B. (2008). Challenging “factor cluster segmentation”. Journal of Travel Research, 47(1), 63-71.
Dolnicar, S., & Leisch, F. (2000). Behavioural market segmentation using the bagged clustering approach based on binary guest survey data: Exploring and visualizing unobserved heterogeneity. Tourism Analysis, 5(2-4), 163-170.
Dolnicar, S., & Leisch, F. (2003). Winter tourist segments in Austria – Identifying stable vacation styles for target marketing action. Journal of Travel Research, 41(3), 281-193.
Dolnicar, S., & Leisch, F. (2004). Segmenting markets by bagged clustering. Australasian Marketing Journal, 12(1), 51-65.
Dolnicar, S., & Leisch, F. (2010). Evaluation of structure and reproducibility of cluster solutions using the bootstrap. Marketing Letters, 21(1), 83-101.
Dolnicar, S., & Leisch, F. (2013). Using graphical statistics to better understand market segmentation solutions. International Journal of Market Research, 56(2), 97-120.
Dolnicar, S., & Leisch, F. (2017). Using segment level stability to select target segments in data-driven market segmentation studies. Marketing Letters, 28, 243-436.
Dolnicar, S., (2014). The diamond professor – A profile of Josef Mazanec. Anatolia, 25(2), 322-332.
Dolnicar, S., Grabler, K., & Mazanec, J. A. (1999). Analysing destination images: A perceptual charting approach. Journal of Travel & Tourism Marketing, 8(4), 43-57.
Dolnicar, S., Grün, B., & Leisch, F. (2016). Increasing sample size compensates for data problems in segmentation studies. Journal of Business Research, 69, 992-999.
Dolnicar, S., Grün, B., & Leisch, F. (2018). Market segmentation analysis: Understanding it, doing it, and making it useful. New York: Springer.
Dolnicar, S., Grün, B., Leisch, F., & Schmidt, K. (2014). Required sample sizes for data-driven market segmentation analyses in tourism. Journal of Travel Research, 53(3), 296-306.
Dolnicar, S., Kaiser, S., Lazarevski, K., & Leisch, F. (2012). Biclustering – Overcoming data dimensionality problems in market segmentation. Journal of Travel Research, 51(1), 41-49.
Kemperman, A. (2021). A review of research into discrete choice experiments in tourism: Launching the Annals of Tourism Research Curated Collection on Discrete Choice Experiments in Tourism. Annals of Tourism Research, 87, 103137.
Mauri, C., & Nava, C. R. (2021). Do tourists experience boredom in mountain destinations? Annals of Tourism Research, 89, 103213.
Mazanec, J. A. (2000). Market segmentation. In J Jafari (Ed.), Encyclopaedia of tourism. London: Routledge.
Mazanec, J. A., Ring, A., Stangl, B., & Teichmann, K. (2010). Usage patterns of advanced analytical methods in tourism research 1988–2008: A six journal survey. Information Technology & Tourism, 12(1), 17-46.
Myers, J. H., & Tauber, E. (1977). Market structure analysis. Chicago, IL: American Marketing Association.
Sheppard, A. G. (1996). The sequence of factor analysis and cluster analysis. Tourism Analysis, 1, 49-57.
Zins, A. (2008). Market segmentation in tourism. From the “OLD” to the “NEW” tourism: Managing change in the tourism industry, Berlin: Erich Schmidt Verlag, pp. 289-301.
